
Chapters
10 Environment and Resources
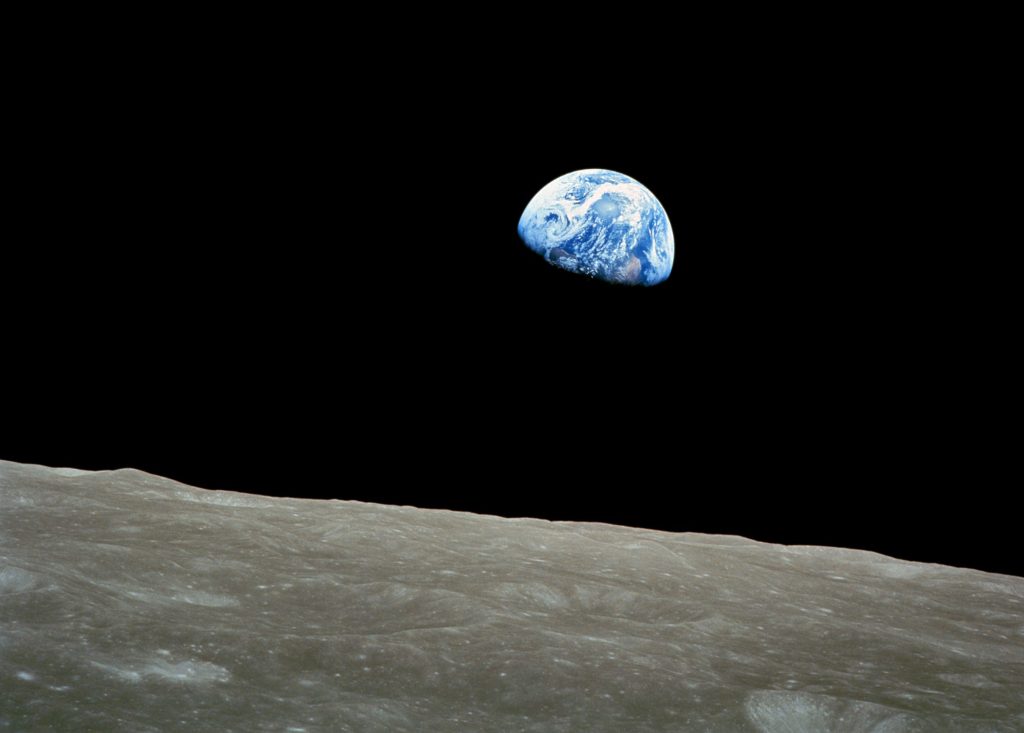
On December 24, 1968, Apollo 8 astronauts on the first manned mission to the moon sent back a now iconic photo of Earth (see Figure 10.1). Command Module Pilot Jim Lovell said during the voyage, “The vast loneliness is awe-inspiring and it makes you realize just what you have back there on Earth.” Astronauts and tourists who have been able to glimpse the edge of space have experienced similar feelings of transformational awe as a result of seeing Earth from a distance, what is now termed the “Overview Effect.” But this effect is not limited to the 600 or so people who have flown into space. Rather, it’s a sentiment many of us have likely experienced in different ways.
Perhaps you’ve stood on the shoreline of a beach at sunset, gazing across the endless horizon of the ocean. Maybe you’ve found yourself in the serene quiet of an International Dark Sky Place, shielded from the usual lights of our cities, where instead the brilliance of the stars illuminates the night sky. Or perhaps you’ve reached the top of a mountain or peered into the depths of a canyon, marveling at the view. These moments of wonder and appreciation are reminders of our deep-rooted connection to the environment.
While we often perceive ourselves as distinct from the natural world, the truth is that we are intricately intertwined with it. The environment not only shapes our human experience but is also profoundly affected by our actions. In this chapter, we’ll explore the realm of Human-Environment Interaction. We’ll investigate how we utilize and transform the land and its resources and we’ll confront the undeniable impact of climate change on our lives and our shared future. Just as the astronauts who encountered the “Overview Effect” attest, Earth is our fragile home in the vast expanse of space and it is our responsibility to ensure its care and well-being for future generations.
10.1 The Built Environment
As we briefly explored in Chapter 1 and have reiterated throughout the book, humans interact with the environment in a variety of different ways. Perhaps the most obvious impact of humans on the landscape is our built environment. It is estimated that just 5% of the entire land area of Earth remains untouched. What is the rest? A relatively small percentage, somewhere around 3% (smaller than you might expect), is categorized as a “built-up area,” meaning it is entirely an artificial, impervious surface devoid of life. (Think of an asphalt parking lot or an office building.) But even though built up urban areas represent a relatively small portion of our overall land use, they have significant impacts on the rest of our world and how we use and abuse the land in other areas. Consider how much of the world is devoted to agricultural production, transportation networks, energy production, and infrastructure—much of it to fuel and feed the more than 50% of people who live in cities.
Even in spaces we might generally categorize as “nature,” the vast majority of it has been altered by our presence. Consider the parks and green spaces where you live. How many of the trees are old growth and how many were planted relatively recently in our history? How much of the landscaping is local plants and how much has been carefully cultivated? How have vines and mosses been cleared away for trails? How have native animal habitats been impacted by our criss-crossing transit lines or driven into smaller and smaller areas by urban development? While the so-called concrete jungles of our densely populated cities are often what we immediately think of when we consider the ways we’ve impacted the environment, a closer look reveals just how much of the “natural” world isn’t particularly natural at all.
Our urban areas don’t just impact plants and animals. The urban heat island effect refers to the higher temperatures we find in cities relative to adjacent rural areas. This is the result of concrete and other impervious surfaces absorbing more heat during the day and releasing it slowly at night, compared to rural areas where trees provide shade and the evapotranspiration process of plants helps provide cooling. Cities see daytime temperatures that are up to 7 °F (3.9 °C) higher and nighttime temperatures that are up to 5 °F (2.8 °C) higher than surrounding rural areas. This leads to additional energy use to try and mitigate the impacts of higher temperatures (through an increase in air conditioning use, for example), which increases emissions, further exacerbating the problem. In addition, the impacts of urban heat islands are not felt uniformly across cities. Rather, we often find significant differences in temperatures within cities particularly in low-income areas where there is often less vegetation.
The way we’ve designed and built cities has often exacerbated the impacts of natural disasters as well. The same impervious surfaces that contribute to the urban heat island effect reduce the land’s ability to absorb excess rainfall during heavy storms, leading to increased surface runoff and flooding. Coastal development weakens wetland areas, limiting the ability of the land to naturally protect against storm surges from hurricanes. (There’s a reason they’re called “barrier islands,” after all.) As residential areas encroach on native forests and grasslands in fire-prone areas, there is an increase risk of wildfires—and more potential for the loss of life or property. If a city has poor infrastructure, these negative effects are magnified as residents may struggle to access clean water, health care, and sanitation in the wake of a natural disaster. To mitigate these issues, some cities have turned to more sustainable methods of urban planning, which we’ll explore later in the chapter.
10.2 Natural Resources
Humans utilize a wide array of natural materials from the environment. These natural resources include minerals or materials used to produce commercial or industrial products, but it also includes less tangible resources like sunlight and fresh air. These resources are the foundation of human survival and economic activities, providing us with food, energy, materials for shelter, and more. In some cases, natural resources are used with little modification, such as fishing or collecting wild berries. In other cases, the resources we gather are utilized indirectly, such as burning coal to produce electricity.
We can broadly divide our natural resources into two categories: renewable and non-renewable. Renewable resources are those that can be naturally regenerated or replaced over a human time scale. They have the potential for sustainable use because they are not depleted as quickly as they are replenished, but at times, the rate they are used exceeds the ability of the resource to reproduce themselves. Water is one of the most vital and abundant renewable resources on Earth. Other renewable resources include most foods, wood, and wild sources of meat like fish and game. Importantly, mismanagement of these resources could mean they are not able to replenish themselves faster than they are being used. Clear cutting a forest, for example, or drawing more water from an aquifer than will be replaced naturally through rainfall can deplete resources labeled “renewable.” Some resources are not just renewable but are unlikely to ever become depleted on a human time scale. These are known as perpetual resources. Sunlight, wind, flowing water, tides, and geothermal heat are all considered to be perpetual resources.
Non-renewable resources, as the name suggests, are resources that cannot be replaced by natural means as fast as they are used. All fossil fuels are considered to be non-renewable and all were formed in a similar way. Coal, for example, takes millions of years to form and is made up of swampy vegetation that was buried under water and dirt. The heat and pressure formed the layers of coal we find today. The petroleum and natural gas we use is similarly derived from the remains of marine plants and animals that were buried millions of years ago. Nuclear energy is not considered to be renewable since it relies on a form of uranium that is extremely rare. However, nuclear energy is considered to be a low-carbon fuel since it does not produce greenhouse gases. Minerals like iron ore or copper, gypsum (used in construction materials), precious gems like diamonds, rare Earth elements often used to create high-performance magnets, and other elements like helium are all non-renewable resources.
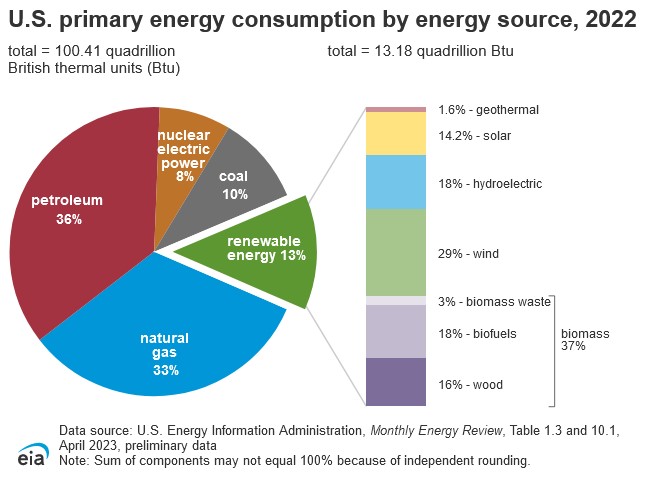
Natural resources also include our sources of energy, some of which are nonrenewable, some of which are renewable. As mentioned, energy derived from fossil fuels or nuclear power is considered to be non-renewable. On the other hand, solar power, hydropower, wind power, geothermal power, and biomass (the burning of wood or municipal waste) are all renewable sources of providing electricity. Within the United States, the vast majority of our energy (almost 80%) comes from fossil fuels (see Figure 10.2). Renewable sources of energy currently only account for around 13% of our energy production. But things are changing. In 2018, solar and wind energy accounted for just 8% of new energy generation in the U.S. As of 2023, that figure has doubled to 16%.
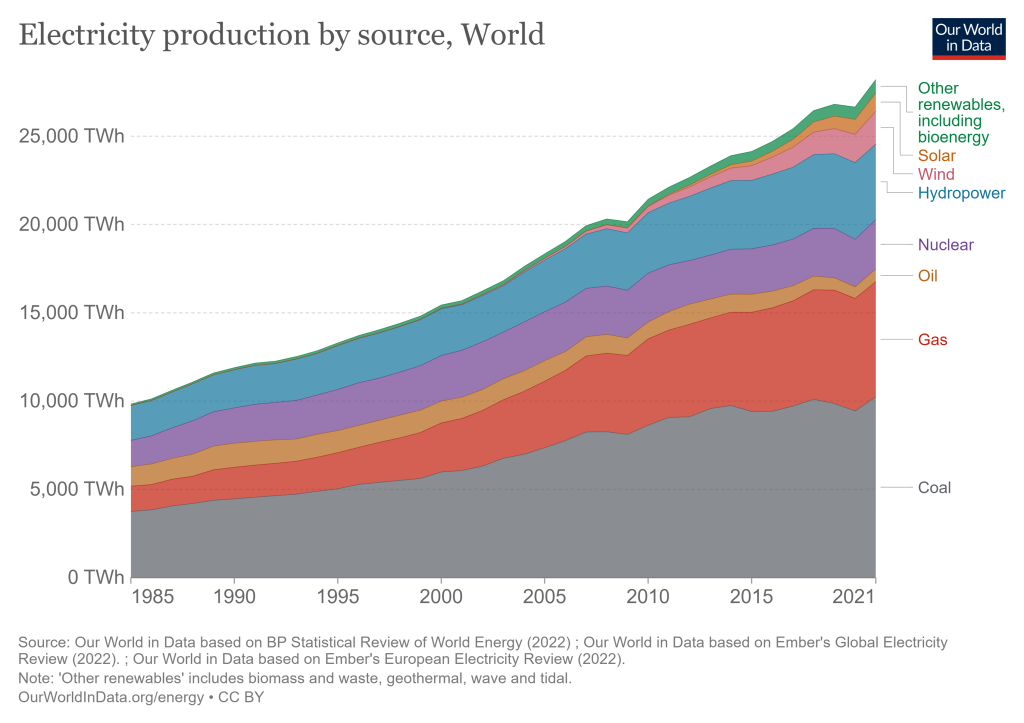
Around the world, we are seeing similar shifts. Fossil fuels remain the dominant source of energy worldwide, with coal accounting for over 35% of the global energy production and natural gas accounting for 22% (see Figure 10.3). But renewable sources of energy have seen significant growth in recent years as governments have committed to reducing greenhouse gas emissions and combating global warming.
10.3 Water Availability, Quality, and Rights
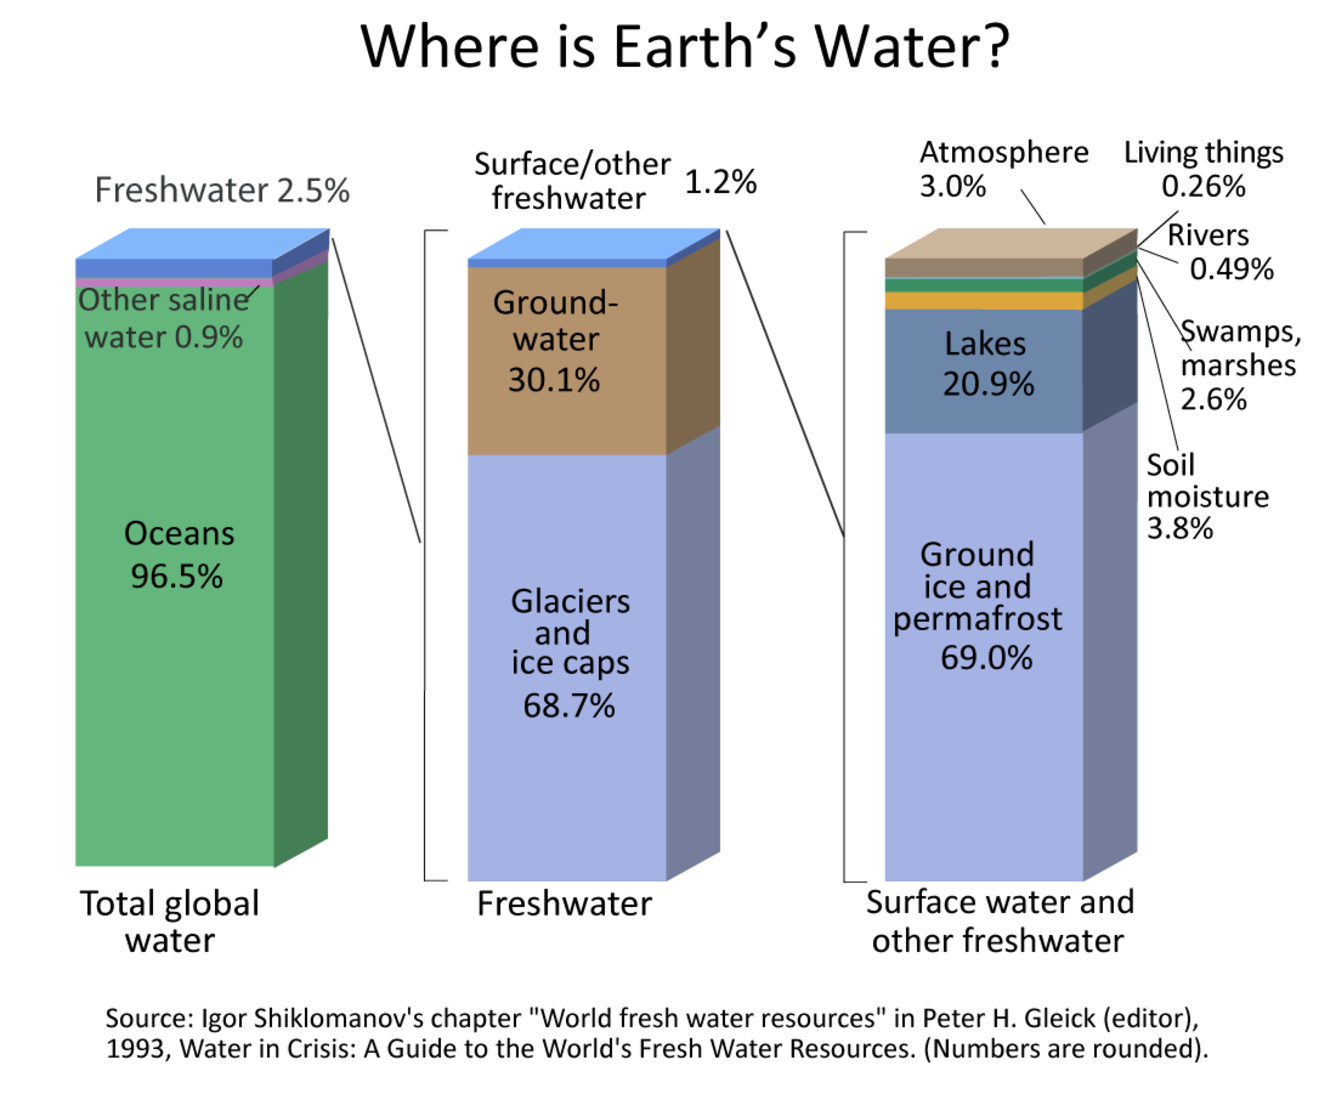
Perhaps our most important natural resource is clean water. Having access to clean water is critically important for our own health but also to agriculture and to the plants and animals that inhabit our Earth. And a huge percentage of Earth is water—71% of the entire surface of our planet is covered with water! Most of this, though, is salt water. In fact, just 2.5% of all of Earth’s water is freshwater (see Figure 10.4). Of this, a large portion (almost 70%) is trapped in glaciers or ice caps or is underground. Only around 0.3% of all of our freshwater sources are in liquid form easily accessible to us on Earth’s surface. That is a tiny amount! And, as mentioned, while water is considered to be a renewable resource, the relatively minuscule amount of freshwater available to us can quickly be depleted faster than it is able to be replenished, or could become polluted.
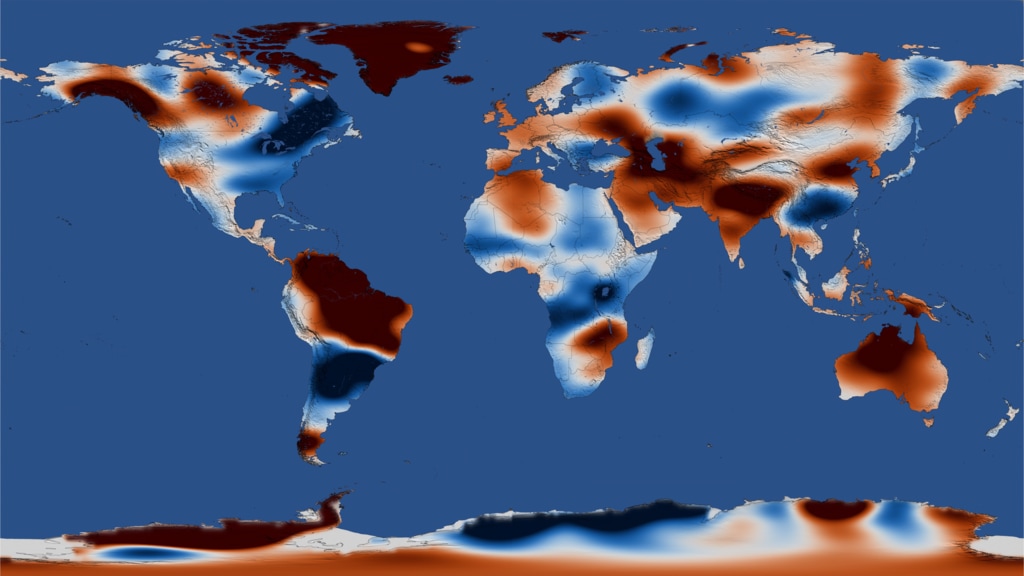
Globally, the availability of freshwater is not uniformed and has also shifted in recent years. Climate change has led to freshwater loss from the polar regions. In other areas, people have used an increasing amount of water to irrigate crops to compensate for climate changes such as a lack of rainfall and higher temperatures. Natural cycles and differences in water management practices have also impacted the availability of water. As Figure 10.5 displays, some areas have significantly more stored freshwater than the average (displayed in blue in the map) and other regions have significantly less (displayed in orange).
What this means for humans on Earth is that currently, according to the United Nations, almost two-thirds of the world’s population currently experiences severe water scarcity for at least one month of the year. Even within the United States, increasing demand coupled with changes in climate will mean significant water shortages in the coming decades. Already, around half of the U.S. has experienced drought conditions in recent years.
This lack of availability of freshwater has fueled conflicts in many regions. One significant challenge is that water doesn’t always correspond to national or regional boundaries. A river might run through three different countries. A lake may be situated on the border between countries with an international dividing line cut through the middle. In these cases, how one country uses a water resource upstream may dramatically affect water quality and availability downstream. Ethiopia began constructing a dam on the Blue Nile River (a tributary of the larger Nile River) in 2011 to produce hydroelectric power and the dam began production in 2022. The government of Egypt, however, which relies on the Nile for irrigation and drinking water, opposed the project saying it would reduce downstream flows (a point Ethiopia denies). Smaller projects have also courted controversy. Caroline County, located in Virginia (USA) has proposed building a pump station to divert water from the Rappahannock River and carry it along pipes to provide irrigation for agriculture and cooling for the data centers that have been proposed here. Some farmers who live downstream as well as members of local tribes have opposed the project, however, since it would reduce the amount of water flowing downstream. These same smaller and larger scale disagreements have proliferated as a warming climate and irregular rainfall has meant an increasing reliance on freshwater irrigation systems.
Water quality, too, varies from region to region. Contaminants can sometimes be present in freshwater and may be difficult to see with the naked eye. These can include viruses, bacteria, and other microorganisms as well as metals or industrial chemicals. Sampling a water system is challenging and often requires continued monitoring from a variety of points. Climate change is also impacting global water quality, as heavy rainfall from stronger, more irregular storms can increase surface runoff (creating opportunities for floodwater to mix with wastewater or other pollutants). Groundwater quality can also deteriorate as sources are depleted or inundated with saltwater from rising sea levels. In addition, warmer water temperatures can increase harmful algae blooms.
In addition, humans have significantly altered the natural water cycle in most areas. Well over 80% of native wetlands have now been drained, and importantly, wetlands often serve to hold back salinated seawater from reaching freshwater areas and help filter pollutants. Only around one-third (37%) of Earth’s large rivers remain free-flowing over their entire length. The rest have been dammed, coaxed through channels, pushed back by flood walls, or shifted into reservoirs. Preventing a river from flowing freely impacts the larger floodplain, which historically was the fertile, well-irrigated soil humans first utilized when we developed settled agriculture.
10.4 Pollution
Pollution, both visible and invisible, is unfortunately ever-present in our modern world and is evidence of humanity’s far-reaching impact on the environment. Some sources of pollution are known as point sources. Point source pollution is exactly what it sounds like: it is a source of pollution that you can point to. Pipe leaking untreated waste into the water? Point source. Coal-fired power plant spewing emissions into the air? Point source. Oil spill from a ship? Point source. Because it is easy to identify these sources of pollution, they are generally much easier to manage, perhaps by corralling the oil from a spill and helping to clean the local ecosystem or by installing scrubbers that help remove the carbon-dioxide emissions from a fossil fuel power plant. Environmental laws and regulations can also help curtail some point source polluters.
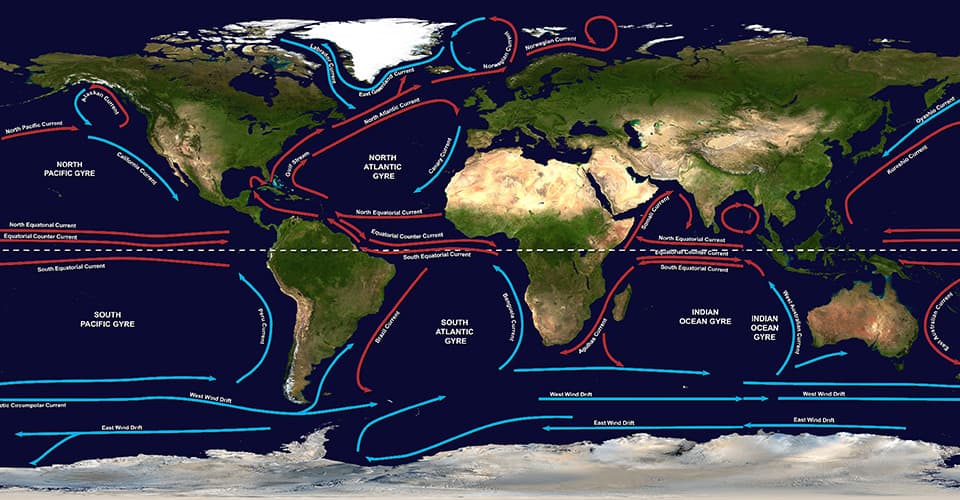
Other sources of pollution are much more difficult to identify and combat. On Henderson Island, a remote, uninhabited island in the south Pacific Ocean that was designated a World Heritage Site because it is one of the few remaining “untouched” atolls in the world, researchers estimate that there are almost 38 million pieces of plastic littering its beaches. This same phenomenon is found across the world’s remote islands. This type of pollution is known as nonpoint source pollution, meaning that it is pollution resulting from a variety of sources that cannot be easily pinpointed. The plastics on Henderson Island, for example, which range from tiny micro-plastics to water bottles to hampers, include remnants from industrial fishing vessels, litter from South America, and debris from the United States, the Netherlands, and Japan, among other countries. These plastics are carried vast distances along the South Pacific Gyre, a counter-clockwise current in the southern Pacific Ocean. Each of the major water bodies in the world has these gyres (see Figure 10.6), and you can see how runoff or the improper disposal of trash in one area could travel extremely long distances.
Other examples of nonpoint sources of water pollution include runoff, which carries chemicals such as fertilizers, heavy metals, and other contaminants out to sea. Fertilizers such as nitrogen running off from farmlands and lawns in the United States, for example, have fueled an explosive growth of algae in certain bodies of water, a process known as eutrophication. It might seem counter-intuitive, but adding more nutrients and fertilizers like nitrogen and phosphorus leads to a reduction in oxygen for other plants and animals. This is because when the algae dies off, its decomposition is carried out by bacteria, which consume oxygen during the process. Often, this leads to “dead zones,” where the oxygen level is so reduced that nothing can survive.
Nonpoint source pollution can also be airborne. The release of exhaust from cars, for example, is a common nonpoint source of air pollution. Acid rain is another example of nonpoint source pollution. Acid rain refers to precipitation that is highly acidic and results from emissions of sulfur dioxide and nitrogen oxides into the air. They then mix with water molecules in the atmosphere and form acid. When this acidic rain falls back down to Earth, it can damage local plants, insects, soils, aquatic life forms, and water bodies. Within the United States, environmental regulations have significantly reduced the prevalence of acid rain. Since the 1970s, acid rain levels have dropped 65% in the U.S. In other countries, such China, where factory production and fossil fuel power plants are prevalent, acid rain continues to be an environmental concern.
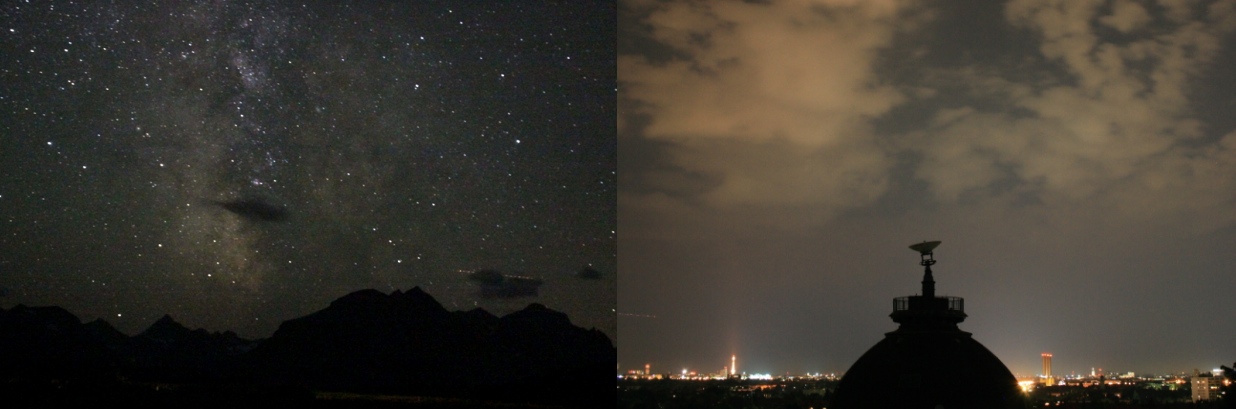
Less obvious forms of pollution include light and noise pollution. It is estimated that over 80 percent of all people live under light-polluted skies. If you’ve ever been to one of the International Dark Sky Places, a location that has been certified to protect the night sky, you’ll know that the view of the countless stars and even the Milky Way is almost indescribably stunning compared to the view of the night sky in areas with light pollution, where perhaps only a handful of stars are visible (see Figure 10.7). Light pollution is not just a problem related to our ability to appreciate our view of the universe, however. Almost all plants and animals have evolved to have a natural circadian rhythm, essentially internal signals that tell us when to feel sleepy and when to feel alert. Researchers have shown that light pollution can disrupt these natural signals. Nocturnal wildlife, for example, are often disrupted by lights at night. Sea turtle hatchlings, who are drawn to the ocean after they hatch, get disoriented by the lights of the nearby built environment and travel inland instead and often die. Light pollution can also exacerbate air pollution because it imitates sunlight, leading to the degradation of a molecule that typically helps cleanse the night air of smog.
Noise pollution similarly might seem like only a problem of our own sensory overload when we hear a passing airplane or highway traffic, but noise pollution has been demonstrated to have a variety of health effects on humans. Researchers have also found that noise pollution is most significant in low-income and racial minority neighborhoods within the United States. Many animals use sound to communicate with other members of their species, and thus noise pollution can have a detrimental impact on migration habits, mating behaviors, and the ability to detect predators. Invertebrate animals in particular are hypersensitive to sound and can lead to noise-induced stress. In marine environments, noise pollution is now commonplace. For many of these animals, who have evolved to use sound as their primary sense, and since sound travels faster in water than through air, noise from shipping, drilling, the use of sonar equipment, and seismic testing can have wide-reaching negative effects.
10.5 Natural Hazards
While compared to the other planets in our solar system, Earth is by far the most hospitable. But even Earth is not without its share of hazards. Natural hazards include geological hazards, like earthquakes and volcanoes, as well as weather-related events, such as flooding, drought, tropical cyclones, and so on. The impacts of these disasters can be worsened by inadequate or improper building practices, the density of people living in vulnerable areas, and our changing climate. In addition, deaths from these natural hazards are more likely to occur in low and middle income countries, which may lack the infrastructure to protect and respond to such events.
Historically, most deaths from natural disasters occurred as a result of droughts or floods. Now, however, the deadliest events are generally earthquakes. Although we might think of the land we live on as relatively stable, Earth’s surface is comprised of large tectonic plates that slowly move and interact with one another, either colliding (a convergent boundary), sliding past one another (transform), or moving apart (divergent) (see Figure 10.8). Where these interactions occur, we find earthquakes and volcanoes. Within the United States, over half of Americans live in earthquake-prone areas, particularly along the west coast. Around the world, we find similar patterns of people tending to live in areas vulnerable to earthquake damage. The cities of Naples, Los Angeles, Istanbul, Cairo, and Tokyo are all built near tectonic faults. Why is this case? It is believed that these tectonically active landscapes fueled more biodiversity. Mountains formed by the collision of tectonic plates have created fertile, sedimentary valleys, and rivers formed from runoff and melting mountain snow. Volcanoes create rich soils and fertile lands for agriculture. Furthermore, our prehistoric ancestors were likely far less impacted by these events since both earthquakes and volcanic eruptions are relatively infrequent and the former is much more dangerous in the modern built environment.

While earthquakes are not preventable, deaths from these natural hazards largely are. By identifying where earthquake hazards exist, monitoring earthquake risk, ensuring buildings in earthquake zones are built to safely withstand earthquake events, and educating the public about earthquake safety, we could greatly reduce the risk of death. In Japan, for example, buildings are subject to strict building codes and are among the sturdiest in the world, often with built-in shock absorbers and earthquake dissipation units. They also have an extensive public education program. All of this costs money, however, and is much less likely to be implemented in vulnerable, low income areas.
Landslides, which can be triggered by heavy rainfall or an earthquake, are similarly are made far worse by human development. The roots of trees and other plants hold soil in place (as anyone who’s tried to dig out a stump can attest) and when areas are deforested or overgrazed, there is nothing to keep the top layers of soil in place and far more soil and rocks will be disturbed if a landslide takes place. As with the devastation from earthquake, landslide deaths are particularly common in low and middle income countries but can be prevented with careful building and land management practices.
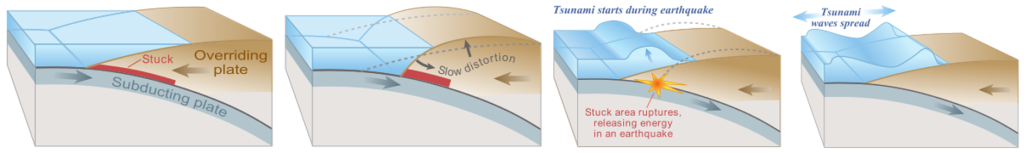
Tsunamis are another geological hazard and are most often caused by undersea earthquakes or volcanic eruptions (see Figure 10.9). (Less commonly, a tsunami could be triggered by an asteroid impact.) Out at sea, waves generated by a tsunami are almost undetectable to boats and can move as fast as a jet engine airplane, but as the wave moves closer to the shore, the height of the wave builds significantly as it slows down. (Wind-generated ocean waves demonstrate the same basic process, which is why waves often appear relatively calm farther out at sea but bunch together and break at the shore.) The wall of water from a tsunami can exceed 100 feet (over 30 meters) in extreme cases and can cause devastation up to a mile inland. The deadliest tsunami on record was triggered by the 2004 Indian Ocean earthquake, which occurred off the west coast of Indonesia. It was the most powerful earthquake ever recorded in Asia and triggered a massive tsunami that killed over 200,000 people.
A variety of natural disasters are caused by extreme weather. Flooding is the most frequent and the most widespread of all of our natural hazards. It is estimated that over the past several decades, flooding has impacted over 2 billion people worldwide. As previously mentioned, flood events are more devastating when natural vegetation is removed, limiting the ability of the land to absorb excess water. These disasters can be caused by heavy rainfall, melting snow, or storm surges from a tropical cyclone. Tropical cyclones more broadly are rapidly rotating storm systems that are characterized by a low pressure center and strong winds. Depending on where they occur, these storms are sometimes called hurricanes or typhoons, but they refer to the same types of storm systems. Warm sea surface temperatures fuel tropical cyclones and thus they tend to form in the summer months. On the other end of the extreme, a lack of rainfall can lead to droughts which in turn increases the risk of wildfires. As we can see, and as we’ll explore in the next section, while we can’t necessarily mitigate the entire risk we’ll encounter a natural disaster, the way we interact with the land can have a significant effect on how likely these events are to occur and how much we’ll be impacted by these hazards.
10.6 Climate Change
As we’ve investigated in this chapter, the ways we as humans have interacted with the environment is much more than the natural landscape shaping how we live and work. Rather, we, in turn, have impacted the environment in profound ways. Perhaps the most significant impact has been on our world’s climate. Throughout its geological and climatic history, Earth has undergone cycles of major ice ages, with the most recent ice age, the Quaternary glaciation, beginning about 2.4 million years ago. Within these longer ice ages are shorter-term periods of warming and cooling where glaciers retreat (known as interglacial cycles) or advance (glacial cycles.) Interestingly, we are technically still in an ice age.
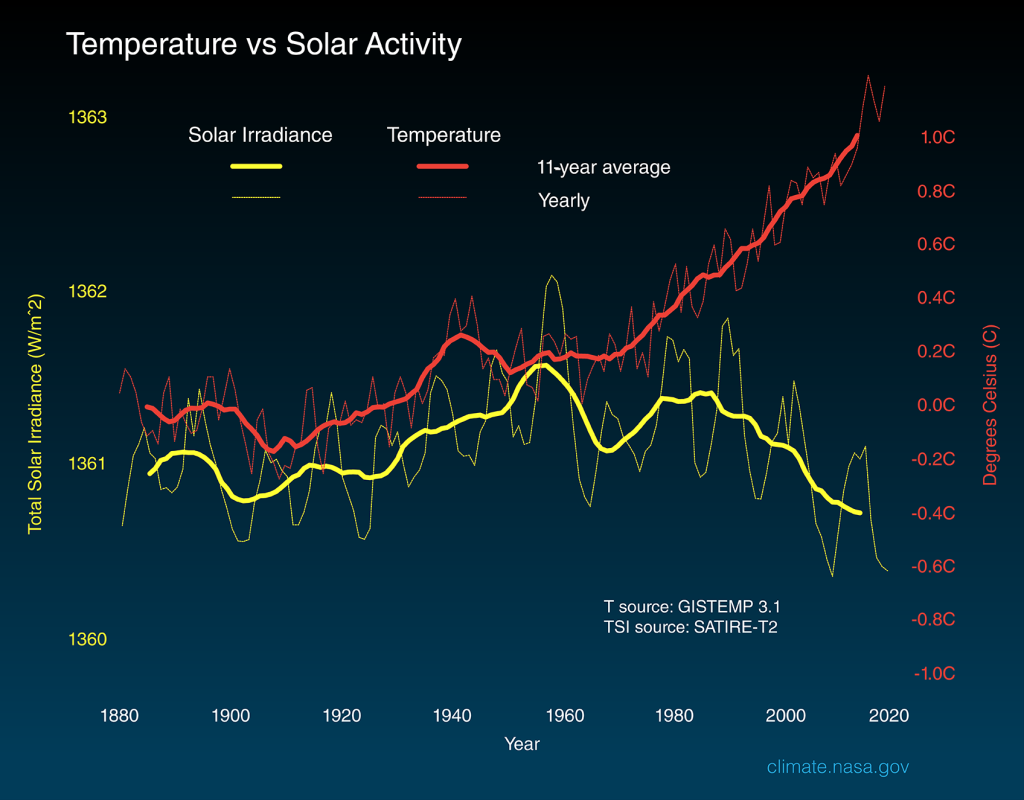
When past ice ages have ended, it’s typically taken around 5,000 years for the planet to thaw out and warm between 7 °F and 12 °F (around 4 to 7 °C). Our current changes in temperature is significantly different, however. In the last 100 years, Earth has warmed around 2 °F (1 °C)—this is over ten times faster than the rate of warming we’ve previously seen after each prior post-ice age period. Additionally, in the past, solar variability has explained some of the changes we’ve seen in our temperatures. However, since the 1750s, the amount of solar energy Earth has received has stayed constant or decreased slightly and has not correlated with the changes in our temperature (see Figure 10.10). Other changes in climate have been attributed to long-term tectonic plate movements, orbital cycles, volcanic eruptions, and ocean current shifts. However, these factors do not account for the current warming.
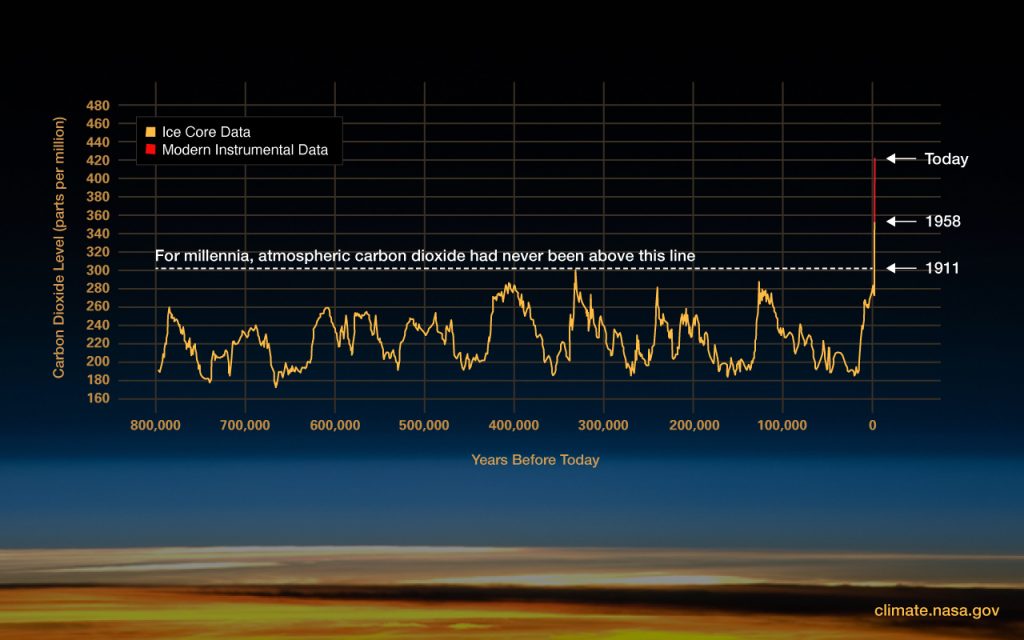
So why do we think that human activity is the principal cause of this warming? One key measure is the amount of carbon dioxide in the atmosphere, as it is a highly influential greenhouse gas that absorbs and re-releases heat. This process is similar to how the glass panels in a greenhouse allow light rays to enter while trapping the heat energy released inside (hence the term “greenhouse gas”). Scientists can study the amount of carbon dioxide in Earth’s atmosphere by collecting ice core samples, columns of ice up to a mile long that are essentially a record of Earth’s atmosphere frozen in time. Based on this evidence, we find that the amount of carbon dioxide in Earth’s atmosphere began to increase in the mid-eighteenth century, coinciding with the start of the Industrial Revolution and the burning of fossil fuels to support industrial machinery. As areas continued to industrialize, and with the advent of fossil fuel burning vehicles, the amount of carbon dioxide released into the atmosphere continued to increase at an unprecedented rate. Today, our level of carbon dioxide in the atmosphere is far greater than it has ever been in the past 800,000 years (see Figure 10.11)
What does this mean for us as modern humans? Surely 2 degrees Fahrenheit (1 degree Celsius) of warming isn’t much—perhaps can just turn on the air conditioning, enjoy a milder winter, or allow our summer gardens to have a longer growing season into fall. However, while an increase in temperature of a couple of degrees doesn’t sound substantial, remember that Earth’s plants and animals are well adapted for conditions that have remained relatively stable for the past several thousand years and we are already seeing dramatic impacts around the globe from these changes to our climate.
Our oceans have absorbed much of this increase in heat leading to wide-ranging changes from mass coral bleaching events on a scale never before seen to changes in the migration patterns of fish toward cooler and deeper waters in order to survive. As ice sheets have melted, the water trapped in them along with the general warming of seawater (remember, when you increase the temperature of something, it expands) has already increased global sea levels 4 inches (101.2 mm) just since 1993! Total sea level rise since record keeping began in 1880 is 8 to 9 inches (21-24 mm), again perhaps not as much of a concern to someone living far inland, but for many island communities, this has led to saltwater intrusion into freshwater sources, the decimation of farmland, and the loss of land area requiring some to migrate as water levels have risen.
Other changes we’re already witnessing is that extreme weather events are increasing in frequency. Dangerous heat waves and record-breaking high temperatures, for instance, are far more common today and are of particular concern for older adults, the very young, and low income communities who might lack the infrastructure to cool their homes. In the 1960s, there were generally around two heat waves per year in the major cities of the United States. Today, there are around six, and the heat wave season is 49 days longer. Consider also the impact of this extreme heat on crops and other plants, particularly combined with the shifting precipation patterns we’ve seen in recent years. Whereas farmers might have previously expected a predictable pattern of rain over the course of a growing season, now a higher percentage of our rainfall comes in intense, single-day events. Tropical cyclone intensity has also increased over the past several decades, since these storms are fueled by warm sea surface temperatures.
As a result of all of these changes, climate migration is on the rise as people have been forced to leave their homes due to an increase in these extreme weather events, as well as to rising seas and reduced freshwater availability. The United Nations High Commissioner for Refugees estimates that around 21.5 million people are displaced every year because of weather-related events and researchers project this number to surge as these types of events become more common, perhaps to as many 1.2 billion people displaced by 2050 (according to the Institute for Economics and Peace). The Intergovernmental Panel on Climate Change (IPCC), the United Nations group that assesses the science related to climate change, predicts that warming will further increase temperatures to a total of 2.7 degrees Fahrenheit (1.5 degrees Celsius) above pre-Industrial levels by the early 2030s. The IPCC aims to limit warming to 2 degrees Celsius (3.6 degrees Fahrenheit), a critical threshold beyond which there would be serious and cascading consequences for much of life on Earth. Some, however, believe that even this target is too generous since we have already seen devastating effects with far less warming.
10.7 A Sustainable Future
Considering all of the challenges we face as modern humans, from the small-scale problems unique to our own lives to the issues we face as a collective human family, can be overwhelming. How can we possibly hope to address such a complex challenge as climate change? Remember, though, that humans have always faced obstacles. As explained in the preface to this text, you come from an unbroken chain of ancestors connecting you back to the first humans that ever walked this Earth. In our galaxy alone, there are trillions of planets, but among these, ours (so far) is the only one known to have life. Think about that for a moment: the fact that we exist on this hospitable planet, connected to this immense family tree of humanity, and can have experiences, can enjoy the world around us, is nothing short of miraculous. What do we owe ourselves, and each other, to ensure that the Earth is protected both now and for future generations?
To ensure a sustainable future for life on Earth will require significant changes, innovations, and a collective effort, but consider the progress we’ve already made on a variety of global issues. In 1990, around 36 percent of the world lived in extreme poverty, living on less than $1.90 per day according to the United Nations. By 2015, that number was down to 10 percent. In 1820, only 10 percent of the world were able to read and write. Now, that number is 85 percent. Childhood mortality used to be so severe that over 40 percent of children didn’t survive their first five years of life in 1800 (again, the fact that we exist in spite of all our ancestors faced is a marvel.) Now, that number is below 4 percent.
On the issue of climate change, too, there is reason to hope. U.S. carbon dioxide emissions peaked in 2007 and have declined on average by around 5 percent per year ever since. Other countries, like China, are expected to reach peak emissions in the next few years and China, in particular, has outpaced its own ambitious targets to shift to renewable energy sources. Additionally, in the past, economic growth was largely tied to fossil fuel emissions, as these fueled (literally) the production of goods and wealthier societies tended to burn more fossil fuels to support their lifestyles. Now, however, many high-income countries are seeing their economic growth decoupled from their emissions. Furthermore, as low-carbon energy becomes cheaper than fossil fuels, there is hope that this decoupling trend will continue.
We might not reach the target of keeping global warming below 2 degrees Celsius (3.6 degrees Fahrenheit) before the end of this century, and even if we stopped emitting all greenhouses gases today, global temperatures would still rise over the next few years since temperature lags behind emissions. The choices we make over the next several years will have impacts for thousands years, according to a report by the IPCC. Everything we can do now to slow and ultimately stop emitting greenhouses gases, developing a more sustainable model of human interaction with the environment, will have positive benefits on our climate and for future on life on Earth.
a phenomenon that refers to localized and elevated temperatures within urban areas compared to their surrounding rural regions
materials or substances drawn from nature that are useful to humans
a natural resource that is able to be replenished during a human time scale
a natural resource that cannot be replaced by natural means as fast as it is consumed
a single discrete source of pollution
refers to the pollution of water or air that does not originate from a single source
a form of precipitation that is highly acidic and results from the emissions of sulfur dioxide and nitrogen oxide
