
5
Learning Goals
-
Relate population genetics to the processes of evolution
-
Explain how the Hardy-Weinberg principle is used in the biological sciences.
-
Given an allele frequency calculate the frequency of different genotypes in a population.
-
Use the Hardy-Weinberg principle to determine if a population is evolving.
Review Question:
Population Genetics
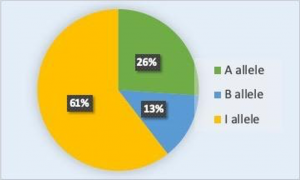
The allele frequency (or gene frequency) is the rate at which a specific allele appears within a population. This can also be thought of as the allele’s percentage in the population relative to the other alleles of that gene in the population. Until now we have discussed evolution as a change in the characteristics of a population of organisms, but behind that phenotypic change is genetic change. In population genetics, the term evolution is defined as a change in the frequency of an allele in a population (i.e. microevolution). Using the ABO blood type system as an example, the frequency of one of the alleles, IA, is the number of copies of that allele divided by all the copies of the ABO gene in the population. For example, a study in Jordan [1] found a frequency of the IA allele to be 26.1 percent. The IB and i alleles made up 13.4 percent and 60.5 percent of the alleles respectively, and all the frequencies added up to 100 percent (Figure 1). A change in this frequency over time would constitute evolution in the population.
The allele frequency within a given population can change under the following conditions: natural selection, sexual selection, genetic drift, gene flow, and mutations. The conditions are collectively called the mechanisms of evolution, specifically microevolution. If any of these mechanisms are in effect, then the population under investigation can undergo changes to its allele frequencies. For example, certain alleles may become more widespread than others through the process of natural selection. If a given allele confers a phenotype that allows an individual to better survive and/or have more offspring in a given habitat or environment. Because many of these offspring will also carry the beneficial allele, and often the corresponding phenotype, they will likely have more offspring of their own that also carry the allele, thus, perpetuating the cycle under those natural conditions. Over time, the allele will proliferate (spread) throughout the population, assuming those natural conditions remain the same (or similar). Some alleles will quickly become fixed in this way, meaning that every individual of the population will carry the allele, while deleterious (detrimental) alleles could potentially be swiftly eliminated from the gene pool, the sum of all the alleles in a population.
Review Question:
Population genetics is the study of:
A) how selective forces change the allele frequencies in a population over time
B) the genetic basis of population-wide traits
C) whether traits have a genetic basis
D) the degree of inbreeding in a population
Hardy-Weinberg Principle of Equilibrium
In the early twentieth century, English mathematician Godfrey Hardy and German physician Wilhelm Weinberg formulated a mathematical principle of equilibrium that could be used to describe the genetic makeup of a population. The theorem, which later became known as the Hardy-Weinberg principle of equilibrium, states that a population’s allele and genotype frequencies are inherently stable— unless, evolutionary forces are acting upon the population, neither the allele nor the genotypic frequencies should change. If a population is in this equilibrium, then it is not evolving and therefore can be thought of as the baseline measurement. Then we can compare all changes in allele frequencies to this baseline and statistically determine if the population is evolving. The Hardy-Weinberg principle assumes conditions with no mutations, migration, emigration, or selective pressure for or against genotype, plus an infinite population. While no population can satisfy those conditions, the principle offers a useful model against which to compare real population changes. Notice these conditions negate the mechanisms of evolution previously listed and therefore we should not expect allele frequencies to change.
Review Question:
A) Populations must be large
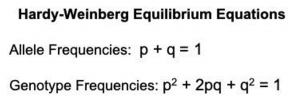
Population geneticists represent different alleles as different variables in this mathematical model. The variable p, for example, often represents the frequency of a particular allele, say the dominant Y for the trait of yellow in peas, then the variable q would represent the frequency of the recessive y alleles that confer the color green. If these are the only two possible alleles for a given locus in the population, p + q = 1 (or 100%). In other words, all the p alleles and all the q alleles make up all the alleles for that locus that are found in the population.
What ultimately interests most biologists is not the frequencies of different alleles, but the frequencies of the resulting genotypes, the population’s genetic structure allows scientists to determine the distribution of phenotypes. When it is a phenotype that can be observed, only the genotype of the homozygous recessive alleles can be known; as individuals with the dominant phenotype can be either homozygous or heterozygous for the trait. However, the use of the Hardy-Weinberg equilibrium equation can be used to calculations an estimate of the remaining genotypes. Since each individual in this model carries two alleles per gene if the allele frequencies (p and q) are known, predicting the frequencies of these genotypes is simple.
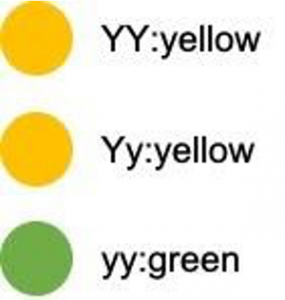
One can easily calculate the probability of getting specific allele combinations (i.e. homozygous dominant, heterozygous, and homozygous recessive) if two alleles are drawn at random from the gene pool. So, in the above scenario, an individual pea plant could be homozygous dominant (YY, yellow peas), heterozygous (Yy, yellow peas), or homozygous recessive (yy, green peas) (Fig. 2). If the frequency of the allele Y = p, then the probability of randomly drawing two Y’s from the gene pool is the product of each allele’s individual probabilities, or p x p = p2. This is the frequency of the homozygous dominant genotype in the population. Likewise, the frequency of y is q, and thus drawing two y’s at random is q x q = q2. This is the frequency of the homozygous recessive genotype in the population.
The heterozygous genotype can be achieved in two ways: drawing a Y and then a y, or drawing a y and then a Y. As these are two separate events, we must add each combination’s probability. First, Y then y equals p x q = pq. Second, y then Y equals q x p = qp. Combining the events: pq + qp = 2pq. This is the frequency of the heterozygous genotype in the population. In this instance, Y and y are the only two alleles in the population, therefore p2 + 2pq + q2 = 1 (or 100%) (Fig. 3).
So, how do population geneticists use these principles to study if the frequency of alleles for a gene in the population is changing? Let’s start with a population of peas, where we can visually count the number of yellow seeds and the number of green seeds. We discover that out of a population of 1000 individuals, 910 individuals produce yellow seeds and 90 individuals produce green seeds. How can we determine the allele frequencies for the Y and y alleles from this information? Well, we know that the green seed individuals must be homozygous recessive (yy) and that the yellow seed individuals can be either homozygous dominant (YY) OR heterozygous (Yy).
As before, we will designate the frequency of the dominant Y allele to be p and the frequency of the recessive y allele to be q. Using the known number of green seed producers we can calculate q. Why? Because we know that all of the green seed producers have the homozygous recessive genotype.
So, frequency of yy equals q2 and thus q2 =90/1000 total or 0.09
The frequency of y = √q , in this case √.09 which is 0.3
Once we have q, we can calculate p; 1 – q = p
p = 1 – 0.3 = 0.7
Finally, the frequency of YY is p2, in this case, 0.49 (0.72) and the frequency of Yy is 2pq (2*0.3*0.7) which is 0.42. Using these frequencies we can determine that of the 910 yellow seed producers 420 are heterozygotes (Yy) and 490 are homozygous dominant.
Review Question:
If the frequency of the dominant allele for a trait in the population is 0.57, what is the frequency of the recessive allele in the population assuming there are only two alleles for the trait?
In theory, if a population is at equilibrium—that is, there are no evolutionary mechanisms acting upon it— generation after generation would have the same gene pool and genetic structure, and these equations would all hold true all the time. Of course, both Hardy and Weinberg recognized that no natural population is immune to evolution. Populations in nature are constantly changing in genetic makeup due to genetic drift, mutation, possibly migration, and selection pressures. As a result, the only way to determine the exact distribution of phenotypes in a population is to go out and count them. What the Hardy-Weinberg principle gives scientists is a mathematical baseline of a non-evolving population to which they can compare natural populations and thereby infer if evolutionary forces might be at play. If the frequencies of alleles or genotypes deviate from the value expected from the Hardy-Weinberg equation, then the population must be evolving.
Review Question:
Summary
End of Section Review Questions:
Review: Microevolution vs. Macroevolution
1) Changes in _________ frequencies in a _________ over time is part of the process of microevolution. Macroevolution focuses on changes _________ in over time.
Word Bank: mutation, species, allele, population, individual
Review: Using Hardy-Weinberg
2) In plants, violet flower color (V) is dominant over white (v). If p = 0.8 and q = 0.2 in a population of 500 plants, how many individuals would you expect to be homozygous dominant (VV)?
Review: Frequencies of Genotypes
Attribution
1 Sahar S. Hanania, Dhia S. Hassawi and Nidal M. Irshaid, 2007. Allele Frequency and Molecular Genotypes of ABO Blood Group System in a Jordanian Population. Journal of Medical Sciences, 7: 51-58. DOI: 10.3923/jms.2007.51.58
AttributionsText adapted from OpenStax Biology 2nd Edition, Biology 2e. OpenStax CNX. Nov 26, 2018 http://cnx.org/contents/8d50a0af- 948b-4204-a71d-4826cba765b8@15.1.
Figure 1. Courtesy of D. Jennings CC By 4.0
Figure 2. Courtesy of D. Jennings CC By 4.0
Evolution Connection:
Evolution and Flu Vaccines
Every fall, the media starts reporting on flu vaccinations and potential outbreaks. Scientists, health experts, and institutions determine recommendations for different parts of the population, predict optimal production and inoculation schedules, create vaccines, and set up clinics to provide inoculations. You may think of the annual flu shot as a lot of media hype, important health protection, or just a briefly uncomfortable prick in your arm. But do you think of it in terms of evolution?
The media hype of annual flu shots is scientifically grounded in our understanding of evolution. Each year, scientists across the globe strive to predict the flu strains that they anticipate being most widespread and harmful in the coming year. This knowledge is based in how flu strains have evolved over time and over the past few flu seasons. Scientists then work to create the most effective vaccine to combat those selected strains. Hundreds of millions of doses are produced in a short period to provide vaccinations to key populations at the optimal time.
Because viruses, like the flu, evolve very quickly (especially in evolutionary time), this poses quite a challenge. Viruses mutate and replicate at a fast rate, so the vaccine developed to protect against last year’s flu strain may not provide the protection needed against the coming year’s strain. The evolution of these viruses means continued adaptions to ensure survival, including adaptations to survive previous vaccines.
Learning Goals
By the end of this reading you should be able to:
- Explain why angiosperms are the dominant form of plant life in most terrestrial ecosystems
- Describe the main parts of a flower and their purposes
- Detail the life cycle of an angiosperm
- Discuss the two main groups of flowering plants
Introduction
Undisputed fossil records place the massive appearance and diversification of angiosperms in the middle to the late Mesozoic era. Angiosperms (“seed in a vessel”) produce a flower containing male and/or female reproductive structures. Fossil evidence indicates that flowering plants first appeared in the Lower Cretaceous, about 125 million years ago, and were rapidly diversifying by the Middle Cretaceous, about 100 million years ago. Earlier traces of angiosperms are scarce. Fossilized pollen recovered from Jurassic geological material has been attributed to angiosperms. A few early Cretaceous rocks show clear imprints of leaves resembling angiosperm leaves. By the mid-Cretaceous, a staggering number of diverse flowering plants crowd the fossil record. The same geological period is also marked by the appearance of many modern groups of insects, including pollinating insects that played a key role in ecology and the evolution of flowering plants (Fig. 1).
Although several hypotheses have been offered to explain this sudden profusion and variety of flowering plants, none have garnered the consensus of paleobotanists (scientists who study ancient plants). New data in comparative genomics have, however, shed some light on the evolution of angiosperms. Rather than being derived from gymnosperms, angiosperms form a sister clade (a species and its descendants) that developed in parallel with the gymnosperms.
From their humble and still obscure beginning during the early Jurassic period, the angiosperms—or flowering plants—have evolved to dominate most terrestrial ecosystems. With more than 250,000 species, the angiosperm phylum (Anthophyta) is second only to insects in terms of diversification. The success of angiosperms is due to two novel reproductive structures: flowers and fruit. The function of the flower is to ensure pollination. Flowers also provide protection for the ovule and developing embryo inside a receptacle. The function of the fruit is seed dispersal. They also protect the developing seed. Different fruit structures or tissues on fruit—such as sweet flesh, wings, parachutes, or spines that grab—reflect the dispersal strategies that help spread seeds.
Most modern angiosperms are classified as either monocots or eudicots, based on the structure of their leaves and embryos. Basal angiosperms, such as water lilies, are considered more primitive because they share morphological traits with both monocots and eudicots.
Flowers and Fruits as an Evolutionary Adaptation
Flowers: Angiosperms produce their gametes in separate organs, which are usually housed in a flower (Fig. 2). Both fertilization and embryo development take place inside an anatomical structure that provides a stable system of sexual reproduction largely sheltered from environmental fluctuations. Flowering plants are the most diverse phylum on Earth after insects; flowers come in a bewildering array of sizes, shapes, colors, smells, and arrangements. Most flowers have a mutualistic pollinator, with the distinctive features of flowers reflecting the nature of the pollination agent. The relationship between pollinator and flower characteristics is one of the great examples of coevolution.
Flowers are modified leaves, or sporophylls, organized around a central stalk. Although they vary greatly in appearance, all flowers contain the same structures: sepals, petals, carpels, and stamens. The peduncle attaches the flower to the plant. A whorl of sepals (collectively called the calyx) is located at the base of the peduncle and encloses the unopened floral bud. Sepals are usually photosynthetic organs, although there are some exceptions. For example, the corolla in lilies and tulips consists of three sepals and three petals that look virtually identical. Petals, collectively the corolla, are located inside the whorl of sepals and often display vivid colors to attract pollinators. Flowers pollinated by wind are usually small, feathery, and visually inconspicuous. Sepals and petals together form the perianth. The sexual organs (carpels and stamens) are located at the center of the flower.
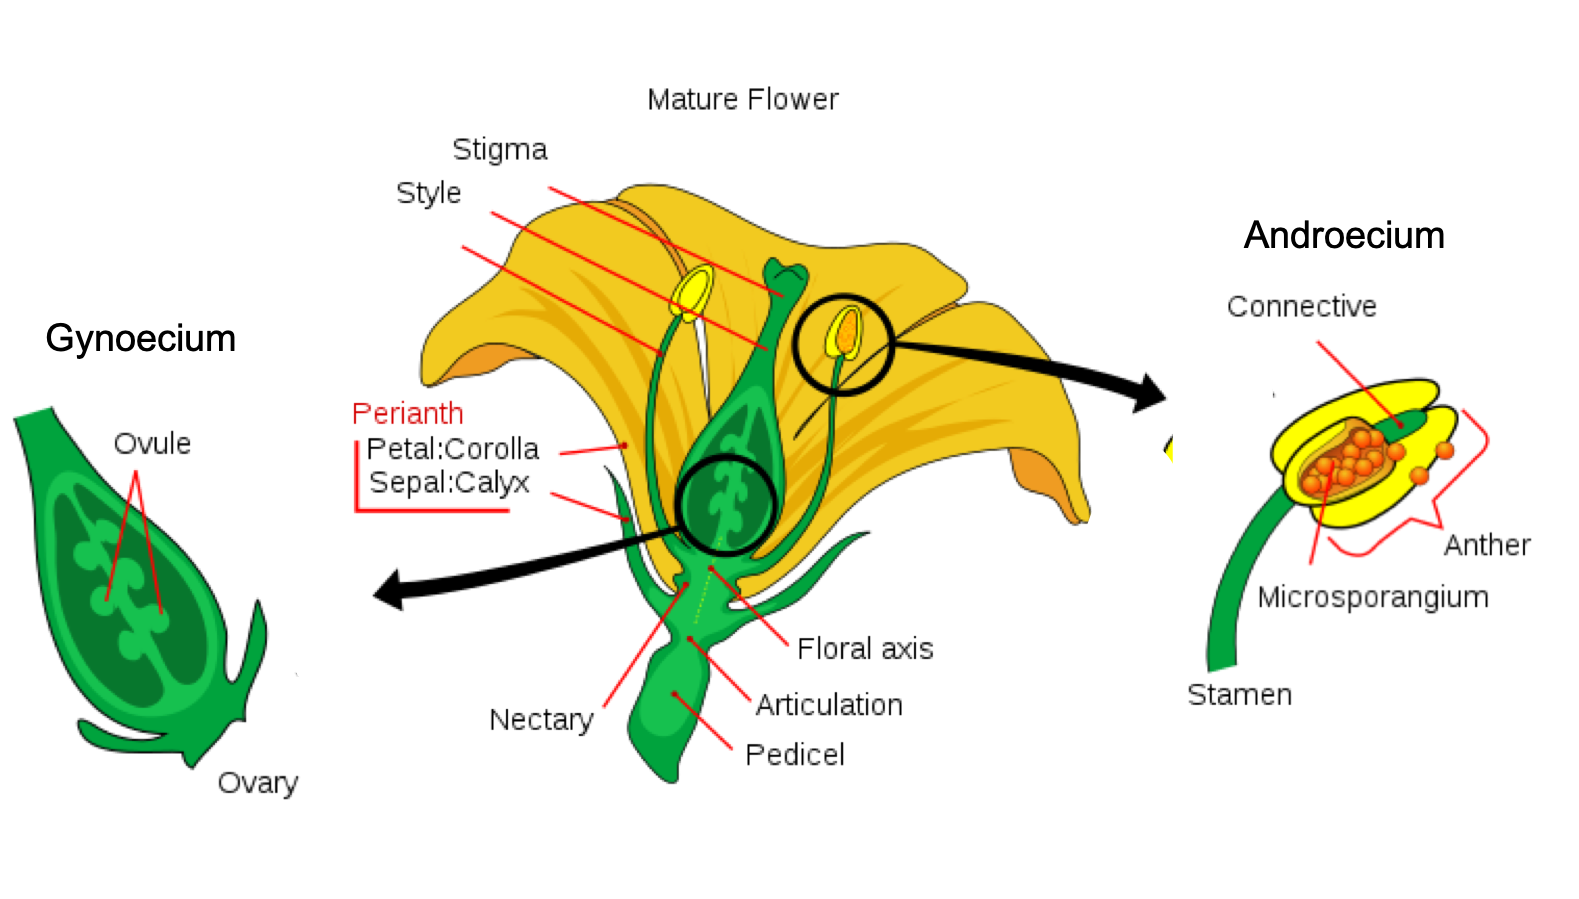
Styles, stigmas, and ovules constitute the female organ: the gynoecium or carpel. The flower structure is very diverse, and carpels may be singular, multiple, or fused. Multiple fused carpels comprise a pistil. The megaspores and the female gametophytes are produced and protected by the thick tissues of the carpel. A long, thin structure called a style leads from the sticky stigma, where pollen is deposited, to the ovary, enclosed in the carpel. The ovary houses one or more ovules, each of which will develop into a seed upon fertilization. The male reproductive organs, the stamens (collectively called the androecium), surround the central carpel. Stamens are composed of a thin stalk called a filament and a sac-like structure called the anther. The filament supports the anther, where the microspores are produced by meiosis and develop into pollen grains.
Review Question:
Fruit: Following fertilization of the egg, the ovule grows into a seed (Fig. 3). The surrounding tissues of the ovary thicken, developing into a fruit that will protect the seed and often ensure its dispersal over a wide geographic range. Not all fruits develop from an ovary; such structures are “false fruits.” Like flowers, fruit can vary tremendously in appearance, size, smell, and taste. Tomatoes, walnut shells, and avocados are all examples of fruit. As with pollen and seeds, fruits also act as agents of dispersal. Some may be carried away by the wind. Many attract animals that will eat the fruit and pass the seeds through their digestive systems, then deposit the seeds in another location. Cockleburs are covered with stiff, hooked spines that can hook into fur (or clothing) and hitch a ride on an animal for long distances. The cockleburs that clung to the velvet trousers of an enterprising Swiss hiker, George de Mestral, inspired his invention of the loop and hook fastener he named Velcro.
As the seed develops, the walls of the ovary thicken and form the fruit. The seed forms in an ovary, which also enlarges as the seeds grow. In botany, a fertilized and fully grown, ripened ovary is a fruit. Many foods commonly called vegetables are actually fruit. Eggplants, zucchini, string beans, and bell peppers are all technically a fruit because they contain seeds and are derived from the thick ovary tissue. Acorns are nuts, and winged maple whirligigs (whose botanical name is samara) are also fruit. Botanists classify fruit into more than two dozen different categories, only a few of which are actually fleshy and sweet.
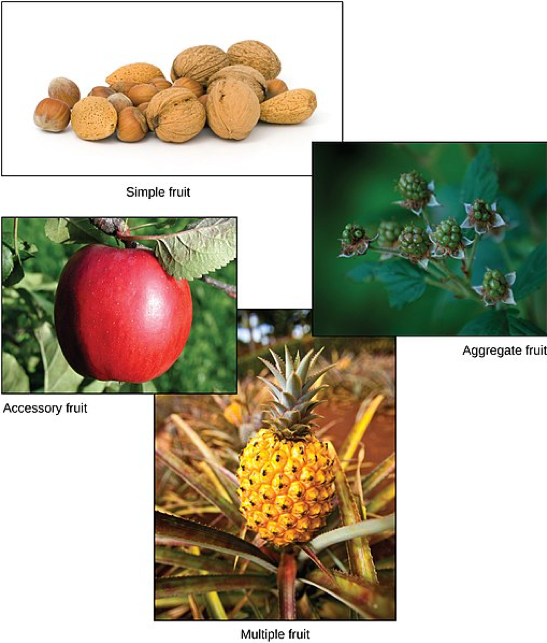
Mature fruit can be fleshy or dry. Fleshy fruit includes familiar berries, peaches, apples, grapes, and tomatoes. Rice, wheat, and nuts are examples of dry fruit. Another distinction is that not all fruits are derived from the ovary. For instance, strawberries are derived from the receptacle and apples from the pericarp or hypanthium. Some fruits are derived from separate ovaries in a single flower, such as the raspberry. Other fruits, such as the pineapple, form from clusters of flowers. Additionally, some fruits, like watermelon and orange, have rinds. Regardless of how they are formed, fruits are an agent of seed dispersal. The variety of shapes and characteristics reflect the mode of dispersal. The wind carries the light dry fruit of trees and dandelions. Water transports floating coconuts. Some fruits attract herbivores with color or perfume, or as food. Once eaten, tough, undigested seeds are dispersed through the herbivore’s feces. Other fruits have burs and hooks to cling to fur and hitch rides on animals.
The Life Cycle of an Angiosperm
The adult, or sporophyte, phase is the main phase of an angiosperm’s life cycle (Fig. 4). Like gymnosperms, angiosperms are heterosporous. Therefore, they generate microspores, which will generate pollen grains as the male gametophytes, and megaspores, which will form an ovule that contains female gametophytes. Inside the anthers’ microsporangia, male gametophytes divide by meiosis to generate haploid microspores, which, in turn, undergo mitosis and give rise to pollen grains. Each pollen grain contains two cells: one generative cell that will divide into two sperm and a second cell that will become the pollen tube cell.
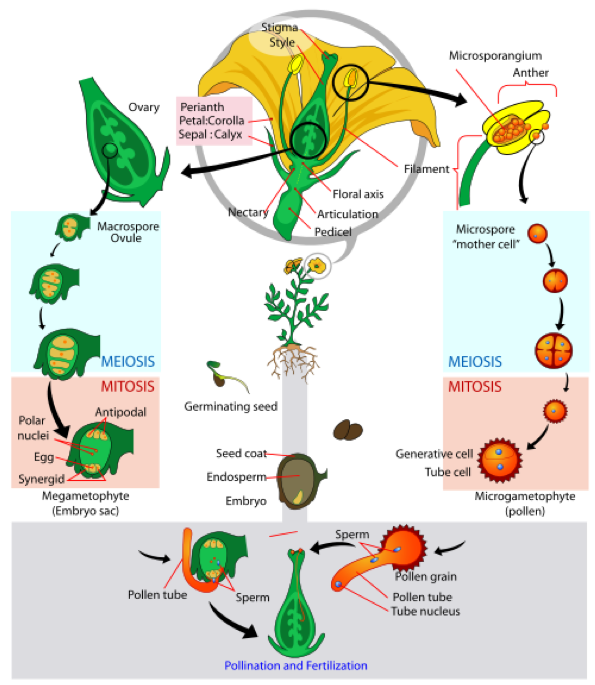
If a flower lacked a megasporangium, what type of gamete would not form? If the flower lacked a microsporangium, what type of gamete would not form? The ovule, sheltered within the ovary of the carpel, contains the megasporangium protected by two layers of integuments and the ovary wall. Within each megasporangium, a megasporocyte undergoes meiosis, generating four megaspores—three small and one large. Only the large megaspore survives; it produces the female gametophyte, referred to as the embryo sac. The megaspore divides three times to form an eight-cell stage. Four of these cells migrate to each pole of the embryo sac; two come to the equator, and will eventually fuse to form a 2n polar nucleus; the three cells away from the egg form antipodals, and the two cells closest to the egg become the synergids. The mature embryo sac contains one egg cell, two synergids or “helper” cells, three antipodal cells, and two polar nuclei in a central cell. When a pollen grain reaches the stigma, a pollen tube extends from the grain, grows down the style, and enters through the micropyle: an opening in the integuments of the ovule. The two sperm cells are deposited in the embryo sac. A double fertilization event then occurs. One sperm and the egg combine, forming a diploid zygote—the future embryo. The other sperm fuses with the 2n polar nuclei, forming a triploid cell that will develop into the endosperm, which is the tissue that serves as a food reserve. The zygote develops into an embryo with a radicle or small root, and one (monocot) or two (dicot) leaf-like organs called cotyledons. This difference in the number of embryonic leaves is the basis for the two major groups of angiosperms: the monocots and the eudicots. Seed food reserves are stored outside the embryo, in the form of complex carbohydrates, lipids or proteins. The cotyledons serve as conduits to transmit the broken-down food reserves from their storage site inside the seed to the developing embryo. The seed consists of a toughened layer of integuments forming the coat, the endosperm with food reserves, and at the center, the well-protected embryo. Most flowers are monoecious or bisexual, which means that they carry both stamens and carpels; only a few species self-pollinate. Monoecious flowers are also known as “perfect” flowers because they contain both types of sex organs. Both anatomical and environmental barriers promote cross-pollination mediated by a physical agent (wind or water), or an animal, such as an insect or bird. Cross-pollination increases genetic diversity in a species.
Review Question:
Diversity of Angiosperms
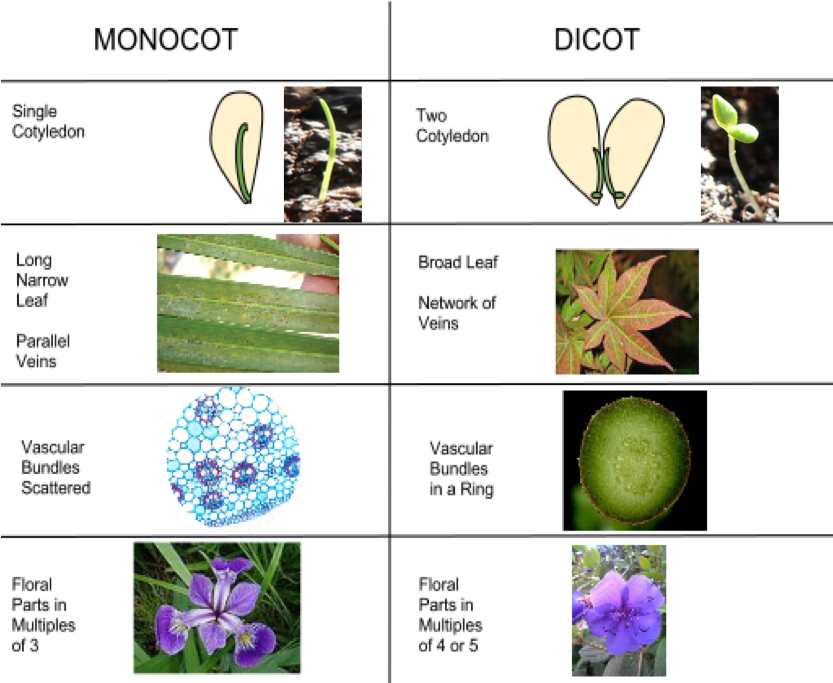
Angiosperms are classified in a single phylum: the Anthophyta. Modern angiosperms appear to be a monophyletic group, which means that they originate from a single ancestor. Flowering plants are divided into two major groups, according to the structure of the cotyledons, pollen grains, and other structures. Monocots include grasses and lilies, and eudicots or dicots form a polyphyletic group (Fig. 5). Basal angiosperms are a group of plants that are believed to have branched off before the separation into monocots and eudicots because they exhibit traits from both groups. They are categorized separately in many classification schemes.
Basal Angiosperms
The Magnoliidae are represented by the magnolias: tall trees bearing large, fragrant flowers that have many parts and are considered archaic. Laurel trees produce fragrant leaves and small, inconspicuous flowers. The Laurales grow mostly in warmer climates and are small trees and shrubs. Familiar plants in this group include the bay laurel, cinnamon, spicebush, and avocado tree. The Nymphaeales are comprised of the water lilies, lotus, and similar plants; all species thrive in freshwater biomes and have leaves that float on the water surface or grow underwater. Water lilies are particularly prized by gardeners and have graced ponds and pools for thousands of years. The Piperales are a group of herbs, shrubs, and small trees that grow in tropical climates. They have small flowers without petals that are tightly arranged in long spikes. Many species are the source of prized fragrance or spices, for example, the berries of Piper nigrum are the familiar black peppercorns that are used to flavor many dishes.
Monocots
Plants in the monocot group are primarily identified as such by the presence of a single cotyledon in the seedling. Other anatomical features shared by monocots include veins that run parallel to the length of the leaves, and flower parts that are arranged in a three- or six-fold symmetry. True woody tissue is rarely found in monocots. In palm trees, vascular and parenchyma tissues produced by the primary and secondary thickening meristems form the trunk. The pollen from the first angiosperms was monosulcate, containing a single furrow or pore through the outer layer. This feature is still seen in modern monocots. The vascular tissue of the stem is not arranged in any particular pattern. The root system is mostly adventitious and unusually positioned, with no major taproot. The monocots include familiar plants such as the true lilies (which are at the origin of their alternate name of Liliopsida), orchids, grasses, and palms. Many important crops are monocots, such as rice and other cereals, corn, sugar cane, and tropical fruits like bananas and pineapples
Eudicots
Eudicots, or true dicots, are characterized by the presence of two cotyledons in the developing shoot. Veins form a network in leaves, and flower parts come in four, five, or many whorls. Vascular tissue forms a ring in the stem; in monocots, the vascular tissue is scattered in the stem. Eudicots can be herbaceous (like grasses) or produce woody tissues. Most eudicots produce pollen that is trisulcate or triporate, with three furrows or pores. The root system is usually anchored by one main root developed from the embryonic radicle. Eudicots comprise two-thirds of all flowering plants. Many species exhibit characteristics that belong to either group; as such, the classification of a plant as a monocot or a eudicot is not always clearly evident.
Review Question:
Summary
Angiosperms are the dominant form of plant life in most terrestrial ecosystems, comprising about 90 percent of all plant species. Most crops and ornamental plants are angiosperms. Their success comes from two innovative structures that protect reproduction from variability in the environment: the flower and the fruit. Flowers were derived from modified leaves. The main parts of a flower are the sepals and petals, which protect the reproductive parts: the stamens and the carpels. The stamens produce the male gametes in pollen grains. The carpels contain the female gametes (the eggs inside the ovules), which are within the ovary of a carpel. The walls of the ovary thicken after fertilization, ripening into fruit that ensures dispersal by wind, water, or animals.
The angiosperm life cycle is dominated by the sporophyte stage. Double fertilization is an event unique to angiosperms. One sperm in the pollen fertilizes the egg, forming a diploid zygote, while the other combines with the two polar nuclei, forming a triploid cell that develops into a food storage tissue called the endosperm. Flowering plants are divided into two main groups, the monocots and eudicots, according to the number of cotyledons in the seedlings. Basal angiosperms belong to an older lineage than monocots and eudicots.
End of Section Review Questions:
D) spore
Review: Floral Structures
Image Attributions
Figure 1. Image modified by D. Jennings. Origin unknown
Figure 2. Image courtesy of Mariana Ruiz LadyofHats [Public domain] Modified by D. Jennings
Figure 3. Image courtesy of CNX OpenStax [CC BY 4.0 (https://creativecommons.org/licenses/by/4.0)]
Figure 4. Image courtesy of LadyofHats Mariana Ruiz [Public domain]
Learning Goals
By the end of this reading you should be able to:
- Describe the structure of xylem and differentiate between tracheids and vessel elements
- Explain how water is moved from roots to leaves of plants
- Relate the movement of water in xylem to the properties of water
- Explain how xylem structure helps to prevent collapse and cavitation
Introduction
On a summer day, a tree can transport many hundreds of liters of water from the soil to its leaves. This is an impressive feat given that it is accomplished without any moving parts. Even more remarkable, trees and other plants transport water without any direct expenditure of energy. The upward transport of water is possible because the structure of vascular plants allows them to use the evaporation of water from leaves to pull water from the soil.
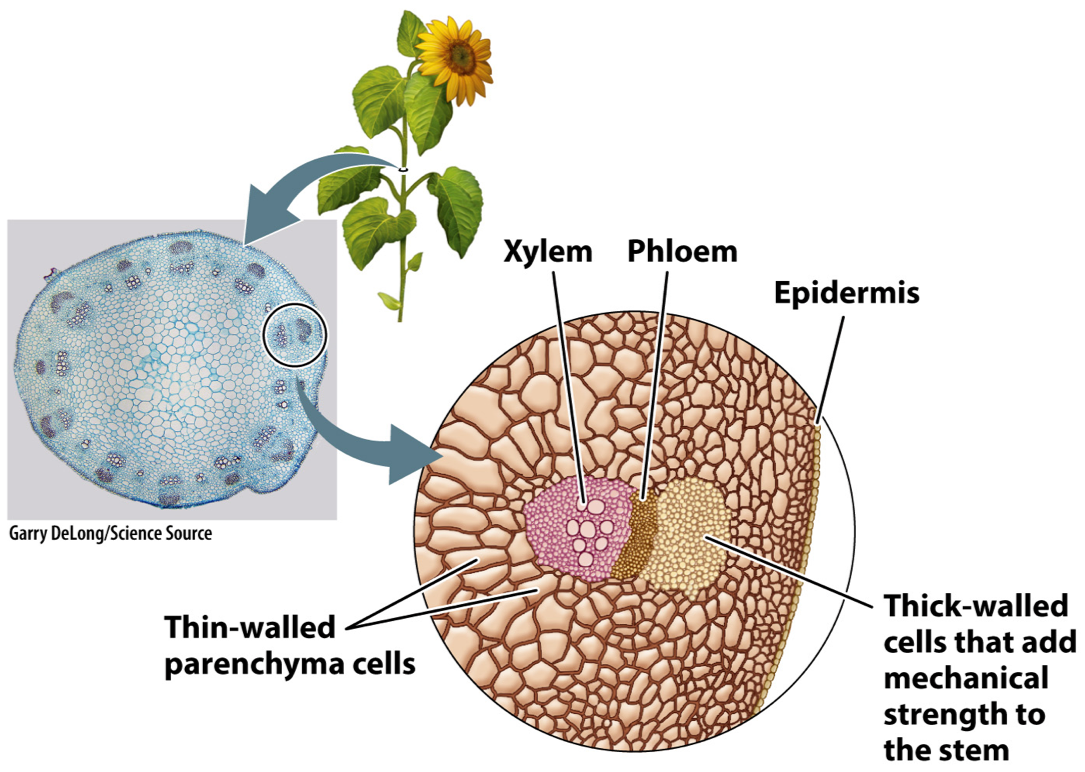
This figure shows the cross-section of a sunflower stem. Like a leaf, it has a surface layer of epidermal cells. This layer encloses thin-walled parenchyma cells in the interior. Notice that the stem also contains differentiated tissues that lie in a ring near the outside of the stem. These are the vascular tissues, which form a continuous pathway that extends from near the tips of the roots, through the stem, and into the network of veins within leaves. The outer tissue, called phloem, transports carbohydrates from leaves to the rest of the plant body. The inner tissue, called xylem, transports water and nutrients from the roots to the leaves.
Multiple answers:Multiple answers are accepted for this question
Xylem Structure: A Low Resistant Pathway for Water
Water travels with relative ease through xylem because of the structure of the water-transporting cells within this tissue. As they develop, these cells become greatly elongated. When they complete their growth, they secrete an additional wall layer that is very thick and which contains lignin, a chemical compound that increases mechanical strength. Most remarkable is the final stage of development when the nucleus and cytoplasm are lost, leaving behind only the cell walls.
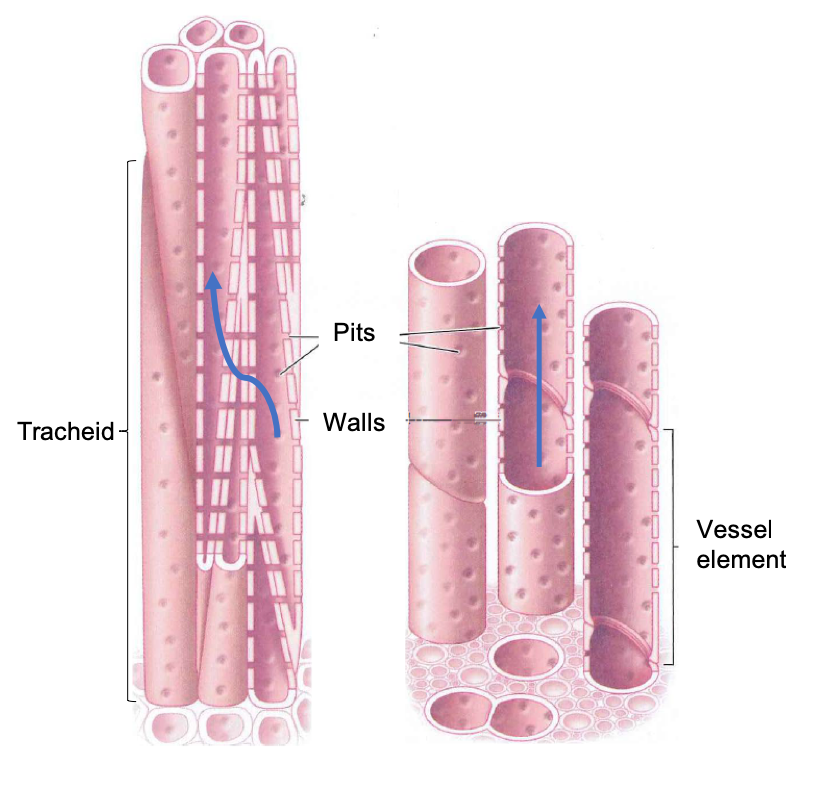
These thick walls form a hollow conduit through which water can flow. Water enters and exits xylem conduits through pits, circular or ovoid regions in the walls where the lignified cell wall layer is not produced. Instead, pits contain only the thin, waterpermeable cell wall that surrounded each cell as it grew. As we will see, pits play an important role in xylem because they allow the passage of water, but not air, from one conduit to another.
Xylem conduits can be formed from a single cell or multiple cells stacked to form a hollow tube. Unicellular conduits are called tracheids, and multicellular conduits are called vessels. Because tracheids are the product of a single cell, they are typically 4 to 40 µ,m in diameter and no more than 2 to 3 cm long. Vessels, which are made up of individual cells called vessel elements, can be much wider and longer. Vessel diameters range from 5 to 500 µm, and lengths can be up to several meters.
Water enters a tracheid through pits, travels upward through the conduit interior, and then flows outward through other pits into an adjacent, partially overlapping tracheid. Water also enters and exits a vessel through pits. In contrast to tracheids, however, once the water is inside the vessel, little or nothing blocks the flow of water from one cell to the next. That is because during the development of a xylem vessel, the end walls of the vessel elements are digested away, allowing water to flow along the entire length of the vessel without having to cross any pits. At the end of a vessel, however, the water must flow through pits if it is to enter an adjacent vessel and thereby continue its journey from the soil to the leaves.
The rate at which water moves through xylem is a function of both the number of conduits and their size. Conduit length determines how often water must flow across pits, which exert a significant resistance to flow. Conduit width also has a strong effect on the rate of water transport. Like the flow through pipes, water flow through xylem conduits is greater when the conduits are wider. The flow is proportional to the radius of the conduit raised to the fourth power, so doubling the radius increases flow sixteenfold. Because vessels are both longer and wider than tracheids, plants with vessels achieve greater rates of water transport than is possible through tracheids alone. Tracheids are the most common conduits in lycophytes, ferns and horsetails, and gymnosperms, whereas vessels are the principal conduit in angiosperms.
Moving water without energy
Water is pulled through xylem by an evaporative pump. If you cut a plant's roots off underwater, the leaves continue to transpire for some time. The persistence of transpiration when roots are absent demonstrates that the driving force for water transport is not generated in the roots, but instead comes from the leaves. In essence, water is pulled through the xylem from above rather than being pushed from below.
The forces pulling water upward through the plant are large. Not only must these forces be able to lift water against gravity, but they must also be able to pull water from the soil, which becomes increasingly difficult as the soil dries. In addition, they must be able to overcome the physical resistance associated with moving water through the plant itself. To replace water lost by transpiration with water pulled from the soil, the leaves must exert forces that are many times greater than the suctions that we can generate with a vacuum pump. How do leaves exert this force?
When stomata are open, water evaporates from the walls of cells lining the intercellular air spaces of leaves. The partial dehydration of the cell walls creates a force that pulls water towards the sites of evaporation. One hypothesis for how this force is generated is that water is pulled by capillary action into spaces between the cellulose microfibrils in the cell wall, the same reason that water is drawn into a sponge. A second hypothesis is that the pectin gel in which the cellulose microfibrils are embedded causes water to flow into the partially dehydrated cell walls by osmosis. Osmotic forces can be generated in cell walls because the negatively charged pectin network restricts the diffusion of positively charged ions, much as the plasma membrane maintains a high concentration of solutes in the cytoplasm.
Once generated by the evaporation of water from leaves, this force is transmitted through the xylem, beginning in the leaf veins, then down through the stem, and out through the roots to the soil
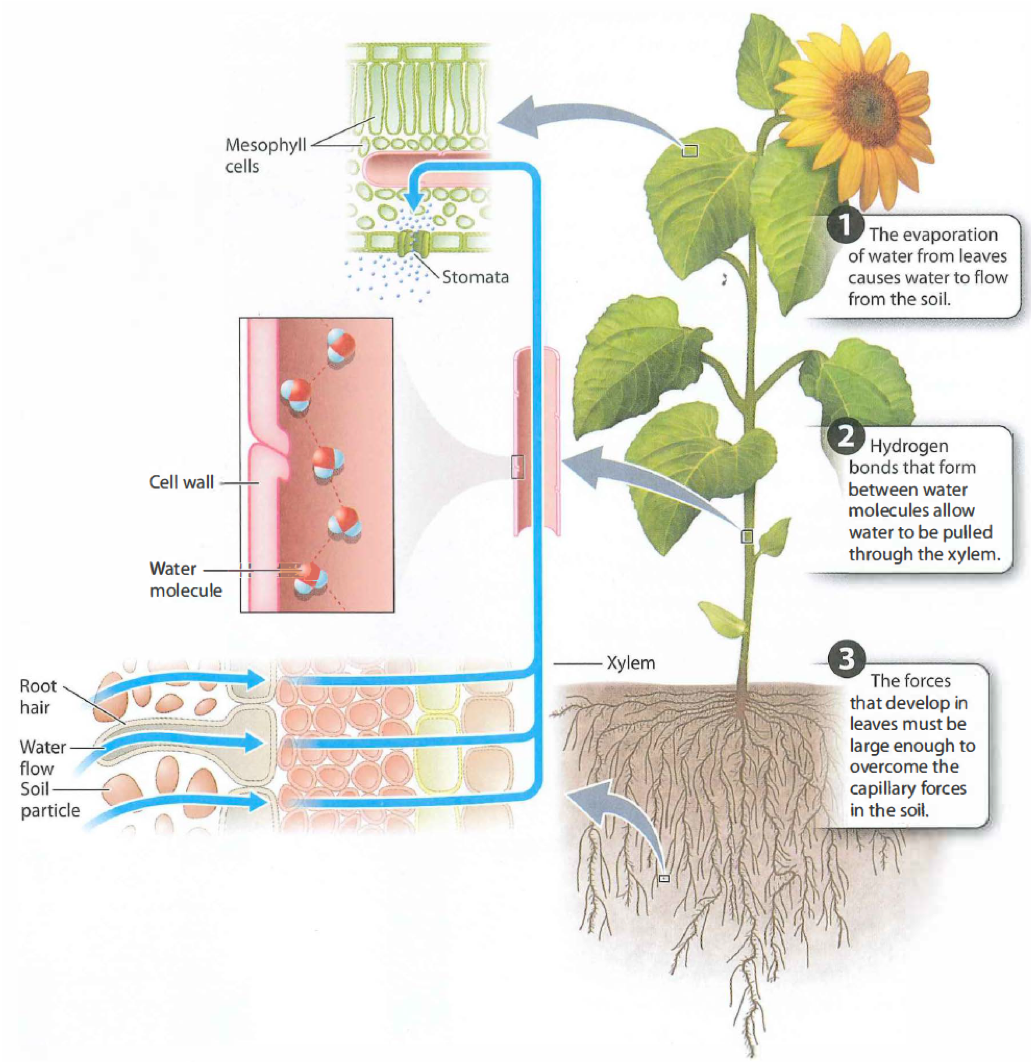
Water can be pulled through xylem because of the strong hydrogen bonds that form between water molecules(cohesion). The xylem structure also enhances the ability of water molecules to bind to other surfaces (adhesion). These mechanisms of water transport only work, however, if there is a continuous column of water in the xylem that extends from the roots to the leaves. This video will help you to visualize the process of transpiration.
The structure of xylem conduits reduces the risks of collapse and cavitation.
The fact that water is pulled from the soil means that xylem conduits must be structured in such a way as to minimize two distinct risks. The first is the danger of collapse. If you suck too hard on a drinking straw, it will collapse inward, blocking flow. Much the same thing can happen in the xylem. Although in metabolic terms, lignin is more costly to produce than cellulose, lignin makes conduit walls rigid, reducing the risk of collapse.
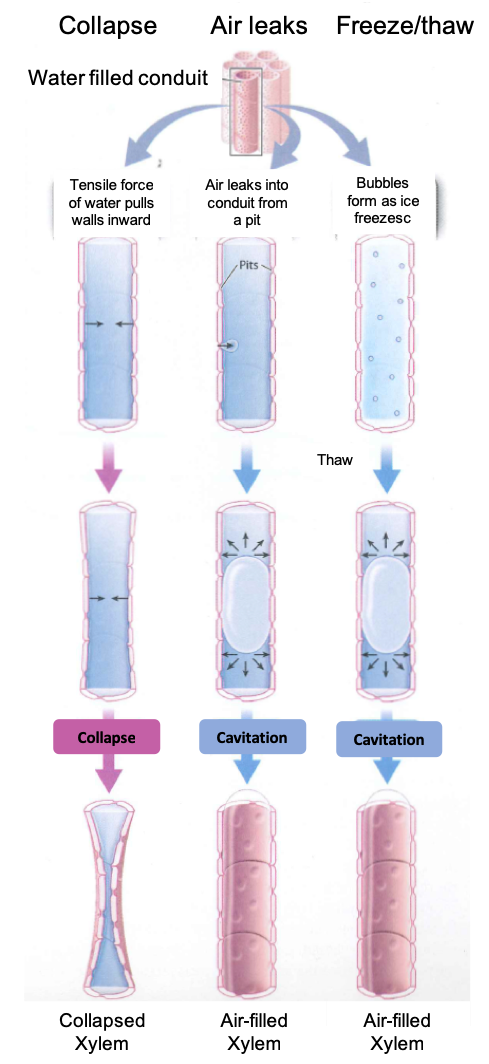
The second danger associated with pulling water through the xylem is cavitation, which occurs when the water in a conduit is abruptly replaced by water vapor. Because cavitation disrupts the continuity of the water column, cavitated conduits can no longer transport water from the soil. Cavitation in xylem results from the presence of microscopic gas bubbles in the water that are sufficiently large that they expand under the tensile, or pulling, the force exerted by the leaves. The microscopic bubbles that cause cavitation can be formed in either of two ways. The first is if an air bubble is pulled through a pit because of lower pressure in the water compared to the air. The larger the tensile forces exerted by leaves, the more likely it is that air will be pulled across a pit. Thus, higher rates of transpiration increase the risk of cavitation.
The second way that gas bubbles can form within xylem is if gases come out of solution during freezing. Gases are much less soluble in ice than in water, so as a conduit freezes, dissolved gas molecules aggregate into tiny bubbles that can cause cavitation when the conduit thaws. Wide vessels are especially vulnerable to cavitation at freezing temperatures. The susceptibility of wide vessels to cavitation partly explains why boreal (that is, subarctic) forests contain few angiosperms, which commonly have large vessel diameters.
Once cavitation has occurred, the liquid phase will not re-form as long as tension persists within the xylem. Thus, xylem is organized in ways that minimize the likelihood and impact of cavitation. For example, xylem consists of many conduits in parallel, so the loss of any one conduit to cavitation does not result in a major loss of transport capacity. Similarly, as water flows from the soil to the leaves, it passes from one conduit to another, each one of finite length. The likelihood that cavitation will spread is thereby reduced because air can be pulled through pits only when the tensile forces in the xylem are large.
Summary
The structure of xylem tracheids and vessel elements in a key component to the movement of water from plant roots to leaves. In addition, the properties of water, adhesion and cohesion, allow the formation of a continuous column of water in the xylem. As the water is pulled up by transpiration cohesion keeps water molecules together, and adhesion of water to the xylem walls helps to keep it from reversing direction. When excessive pressure or the introduction of air bubbles occurs this can impair the capacity of xylem to move water. Xylem tissue, however, is composed of large numbers of cells and thus a large number of pathways within the cells for water movement, thus collapse or cavitation of individual cells has a smaller impact as water moves around these in surrounding cells.
Review Questions
Learning Goals
By the end of this reading you should be able to:
- Describe the structure of phloem
- Differentiate between source and sink tissues in plants
- Explain the pressure-flow mechanism of sugar transport in phloem
- Compare and contrast xylem and phloem structures and functions
- Describe the link between phloem sugars and the rhizosphere
Introduction
Much of the body of a vascular plant is devoted to the uptake and transport of the water required by leaves rather than to photosynthesis. In contrast, all cells of the algal ancestors of plants would have been capable of photosynthesis. Roots and stems contribute indirectly to photosynthesis but produce little or no carbohydrate themselves. Thus, although vascular plants are photosynthetic, a large part of their body must be supplied internally with food.
Phloem Structure
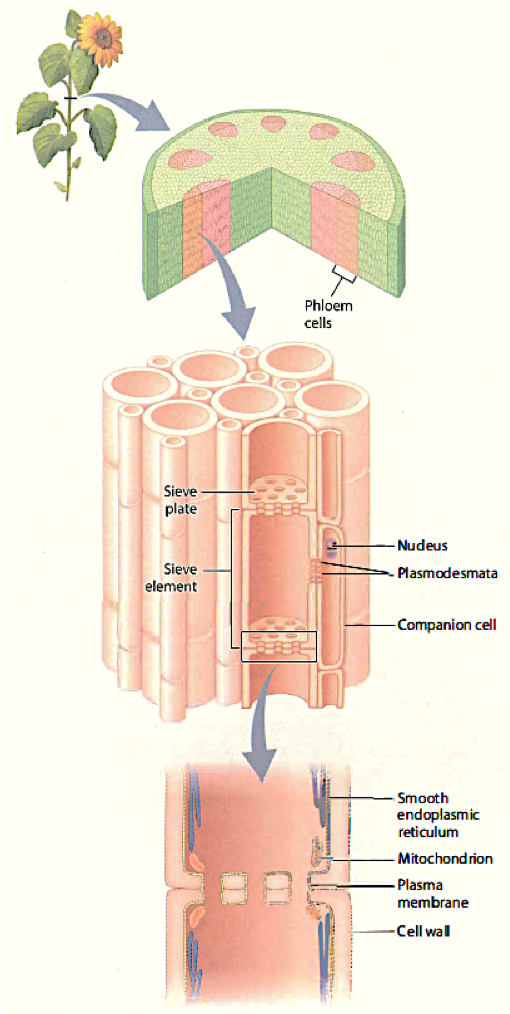
Phloem transport takes place through multicellular sieve tubes, which are composed of highly modified cells called sieve elements that are connected end to end. During development, sieve elements lose much of their intracellular structure, including the nucleus and the vacuole. At maturity, sieve elements retain an intact plasma membrane that encloses a modified cytoplasm containing only smooth endoplasmic reticulum and a small number of organelles, including mitochondria. Cellular functions such as protein synthesis are carried out by an adjacent companion cell, to which the sieve element is connected by numerous plasmodesmata. Sieve elements are linked by sieve plates, which are modified end walls with large (1 to 1.5 µ,m diameter) pores. The plasma membrane of adjacent sieve elements is continuous through each of these pores, so each multicellular sieve tube can be considered a single cytoplasm-filled compartment. Phloem sap is the sugar-rich solution that flows through both the lumen of the sieve tubes and the sieve plate pores.
Multiple answers:Multiple answers are accepted for this question
Sources and Sinks
Phloem transports carbohydrates as sucrose (glucose plus fructose) or larger sugars, assembled from monosaccharides in the cytoplasm. Phloem also transports amino acids, inorganic forms of nitrogen, and ions including K+, which are present in much lower concentrations. Finally, phloem transports informational molecules such as hormones, protein signals, and even RNA. Thus, phloem forms a multicellular highway for the movement of raw materials and signaling molecules across the entire length of the plant.
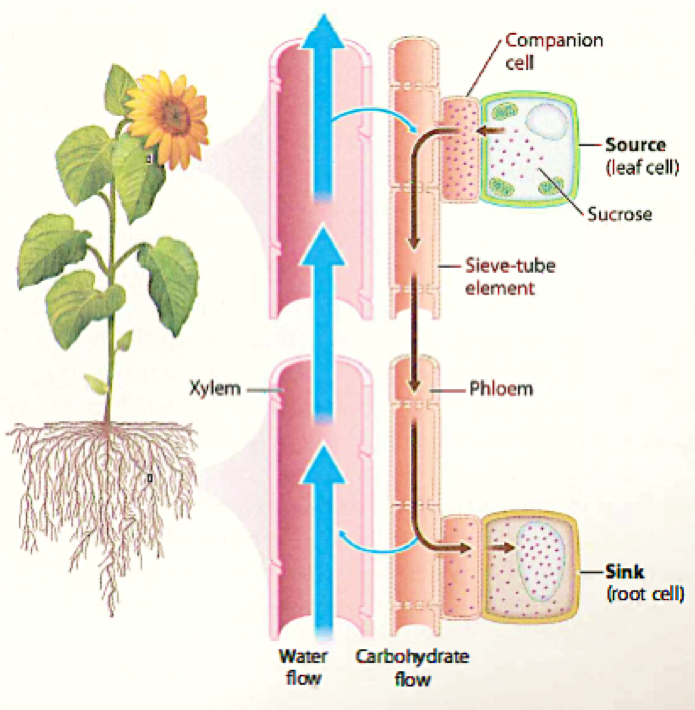
Phloem transports its molecular cargo from source to sink. In plants, sources are the regions that produce or store carbohydrates. For example, leaves are sources because they produce carbohydrates by photosynthesis, and potato tubers after they have been formed are sources because they can supply stored carbohydrates to the rest of the plant body. Sinks are any portion of the plant that needs carbohydrates to fuel growth and respiration-examples are roots, young leaves, and developing fruits. Whereas the direction of xylem transport is always up toward the leaves, the direction of phloem transport can be either up or down, depending on where the source and sink are relative to each other.
Pressure-Flow in Phloem Transport
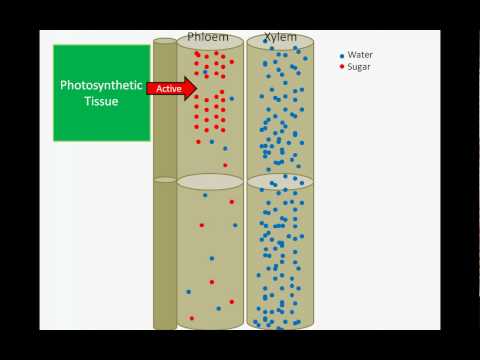
How does phloem transport sugars from source to sink? In some plants, active transporters powered by ATP move sucrose into the phloem. The buildup of sugar concentration causes water to be drawn into the phloem by osmosis. Because the cell walls of the sieve tube resist being stretched outward to accommodate the influx of water, they press back (inward) against the cytoplasm. Their resistance to stretching increases the turgor pressure at the source end of a sieve tube. At sinks, sugars are transported out of the phloem into surrounding cells. This withdrawal of sugars causes water to leave the sieve tube, again by osmosis, reducing turgor pressure at the sink end. It is the difference in turgor pressure that drives the movement of phloem sap from source to sink. This video demonstrates how pressure-flow results in the movement of sugars and how this transport is linked to the movement of water.
The water that exits the phloem can be used locally to support the enlargement of sink cells or it can be carried back to the leaves in the xylem. Thus, some of the water in the phloem sap is recirculated in the xylem. The volume of water that moves through the phloem, however, is tiny compared to the amount that must be transported through the xylem to replace water lost by transpiration. Therefore, the number and size of xylem conduits greatly exceed the number and size of sieve tubes.
Phloem transport is sometimes referred to as "translocation," a term that pairs well with "transpiration." Yet in almost every way, phloem and xylem are a study in contrasts. In phloem, the plant generates the gradient that drives transport, whereas water moving through xylem is driven by the difference in hydration between soil and air. Furthermore, water is pulled upward through xylem conduits, while transport through phloem is more of a push.
These fundamental differences in function explain the cytological differences between xylem and phloem: Phloem conduits retain an intact plasma membrane and modified cytoplasm, whereas xylem conduits retain only their cell walls. What xylem and phloem have in common is that both are essential in enabling vascular plants to carry out photosynthesis on land. Moreover, like xylem, phloem is subject to risks that arise from the way flow through sieve tubes is generated. Damaged sieve tubes are at risk of having their contents leak out, pushed out by high turgor pressures in the phloem. Damage is an ever-present danger because the sugar content of phloem makes it an attractive target for insects. Cell damage activates sealing mechanisms that repair breaks in sieve tubes. In some respects, these mechanisms are comparable to the formation of blood clots in humans, except that phloem can seal itself much more rapidly, typically in less than a second.
Phloem and the Rhizosphere
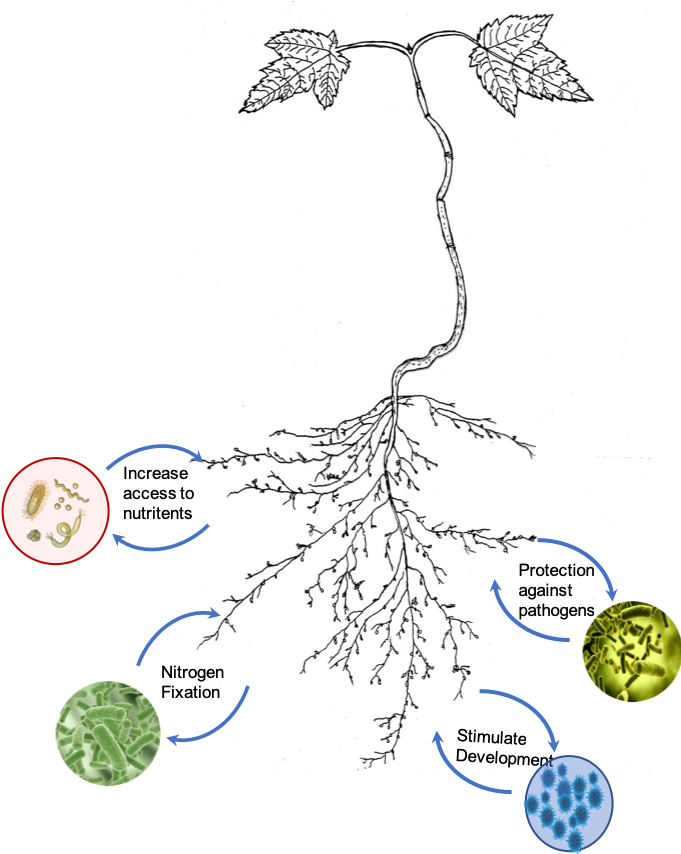
Phloem also supplies carbohydrates to organisms outside the plant. A fraction of the carbohydrates transported to the roots spills out into the rhizosphere, the soil layer that surrounds actively growing roots. This supply of carbohydrates stimulates the growth of soil microbes. As a result, the densities of microbial organisms near roots are much greater than in the rest of the soil. The interactions between soil microbes and plants can vary greatly. Those soil bacteria that are decomposers of soil organic matter, can make nutrients such as nitrogen and phosphorus more accessible to the plant. Other soil microbes can release hormones that stimulate plant growth, aid in atmospheric nitrogen fixation, and some even provide protection against soil plant pathogens. Thus, the release of carbohydrates by roots into the soil is beneficial to the overall growth and survival of the plants.
Summary
All the cells in a plant's body contain mitochondria since all cells need a constant supply of ATP. Typically, about 50% of the carbohydrates produced by photosynthesis in one day are converted back to CO2 by respiration within 24 hours. Carbohydrates that are not immediately consumed in respiration can be used as raw materials for growth, or they can be stored for later use. Carbohydrates stored within roots and stems, or in tubers (specialized storage organs such as potatoes), can support new growth in the spring or following a period of drought. Stored reserves can also be used to repair mechanical damage or replace leaves consumed by insects or grazing mammals. Like their green algal ancestors, vascular plants store carbohydrates primarily as starch, a large molecule that is not soluble and so does not affect the osmotic balance of cells.
What determines how carbohydrates become distributed within the plant? Where phloem sap ends up is determined by the sinks. Phloem transport to reproductive organs appears to have priority over the movement to stems and leaves, and these have priority over movement to roots. Hormones play a key role in controlling the growth and development of plants and these hormones may influence the ability of different sinks to compete successfully for resources delivered by the phloem.
Review Questions
Cells are dead at maturity
Generation of a pressure gradient
Mature cells do not have nuclei
Molecules move due to hydration differences
Are linked to companion cells
Multiple answers:Multiple answers are accepted for this question
Multiple answers:Multiple answers are accepted for this question
Learning Goals
By the end of this reading you should be able to:
- Describe the organizational features of the simplest multicellular animals
- Explain the various body forms and bodily functions of sponges
- Compare structural and organizational characteristics of Porifera and Cnidaria
- Describe the progressive development of tissues and their relevance to animal complexity
Introduction
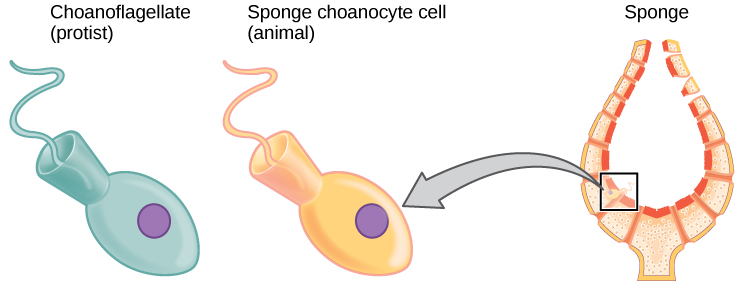
Biologists strive to understand the evolutionary history and relationships of members of the animal kingdom, and all of life, for that matter. Currently, most biologists divide the animal kingdom into 35 to 40 phyla. The current understanding of evolutionary relationships between animal, or Metazoa, phyla begins with the distinction between “true” animals with true differentiated tissues, called Eumetazoa, and animal phyla that do not have true differentiated tissues (such as the sponges), called Parazoa. Both Parazoa and Eumetazoa evolved from a common ancestral organism that resembles the modern-day protists called choanoflagellates (choan - Greek for "funnel"). These protist cells strongly resemble the sponge choanocyte cells today (Fig. 1).
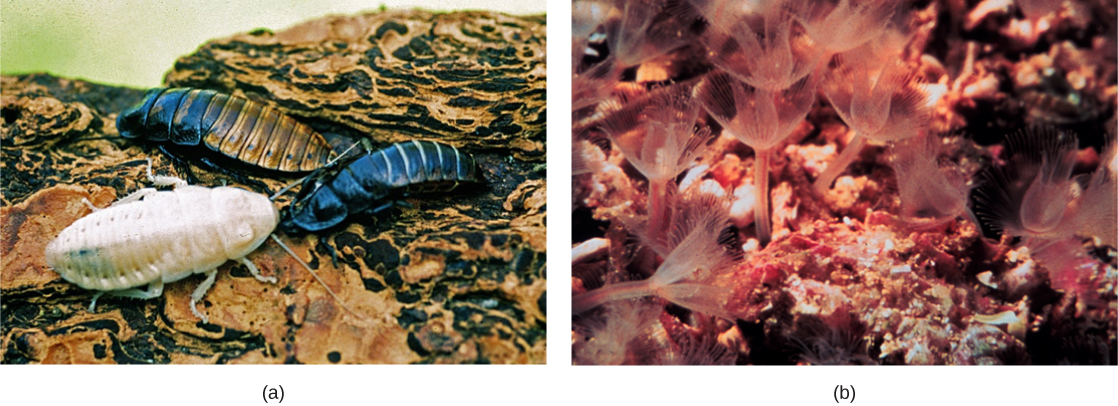
Eumetazoa is subdivided into radially symmetrical animals and bilaterally symmetrical animals, and are thus classified into the clades Bilateria or Radiata, respectively. Cnidarians and ctenophores are animal phyla with true radial symmetry. All other Eumetazoa are members of the Bilateria clade. The bilaterally symmetrical animals are further divided into deuterostomes (including chordates and echinoderms) and two distinct clades of protostomes (including ecdysozoans and lophotrochozoans). Ecdysozoa includes nematodes and arthropods (Fig. 2); they are so named for a commonly found characteristic among the group: exoskeletal molting (termed ecdysis). Lophotrochozoa is named for two structural features, each common to certain phyla within the clade. Some lophotrochozoan phyla are characterized by a larval stage called trochophore larvae, and other phyla are characterized by the presence of a feeding structure called a lophophore.
Phylum Porifera
The invertebrates (Invertebrata) are animals that do not contain bony structures, such as a cranium and vertebrae. The simplest of all invertebrate animals are the Parazoans, which include only the phylum Porifera: the sponges. Parazoans do not display tissue-level organization, although they do have specialized cells that perform specific functions. While the larvae of sponges are able to swim the adults are non-motile (sessile) and spend their life attached to a solid surface. Since water is vital to sponges for excretion, feeding, and gas exchange, their body structure facilitates the movement of water through the sponge. Structures such as canals, chambers, and cavities enable water to move through the sponge to nearly all body cells.

Morphology of Sponges
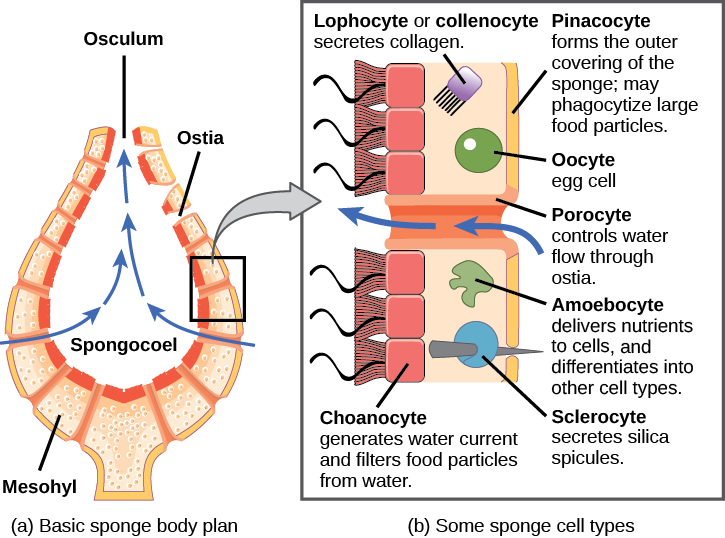
The morphology of the simplest sponges (Fig. 3) takes the shape of a cylinder with a large central cavity, the spongocoel, occupying the inside of the cylinder (Fig. 4). Water can enter into the spongocoel from numerous pores in the body wall. Water entering the spongocoel is expelled through a large common opening called the osculum. However, sponges exhibit a range of diversity in body forms, including variations in the size of the spongocoel, the number of osculi, and where the cells that filter food from the water are located. While sponges (excluding the hexactinellids) do not exhibit tissue-layer organization, they do have different cell types that perform distinct functions. Pinacocytes, which are epithelial-like cells, form the outermost layer of sponges and enclose a jelly-like substance called mesohyl. Mesohyl is an extracellular matrix consisting of a collagen-like gel with suspended cells that perform various functions. The gel-like consistency of mesohyl acts like an endoskeleton and maintains the tubular morphology of sponges. In addition to the osculum, sponges have multiple pores called ostia on their bodies that allow water to enter the sponge. In some sponges, ostia are formed by porocytes, single tube-shaped cells that act as valves to regulate the flow of water into the spongocoel. In other sponges, ostia are formed by folds in the body wall of the sponge. Choanocytes (“collar cells”) are present at various locations, depending on the type of sponge, but they always line the inner portions of some space through which water flows (the spongocoel in simple sponges, canals within the body wall in more complex sponges, and chambers scattered throughout the body in the most complex sponges). Whereas pinacocytes line the outside of the sponge, choanocytes tend to line certain inner portions of the sponge body that surround the mesohyl. The structure of a choanocyte is critical to its function, which is to generate a water current through the sponge and to trap and ingest food particles by phagocytosis. Note the similarity in appearance between the sponge choanocyte and choanoflagellates (Protista). This similarity suggests that sponges and choanoflagellates are closely related and likely share a recent common ancestry. The cell body is embedded in mesohyl and contains all organelles required for normal cell function, but protruding into the “open space” inside of the sponge is a mesh-like collar composed of microvilli with a single flagellum in the center of the column. The cumulative effect of the flagella from all choanocytes aids the movement of water through the sponge: drawing water into the sponge through the numerous ostia, into the spaces lined by choanocytes, and eventually out through the osculum (or osculi). In the meantime, food particles, including waterborne bacteria and algae, are trapped by the sieve-like collar of the choanocytes, slide down into the body of the cell, are ingested by phagocytosis, and become encased in a food vacuole. Lastly, choanocytes will differentiate into sperm for sexual reproduction, where they will become dislodged from the mesohyl and leave the sponge with expelled water through the osculum.
Watch this video to see the movement of water through the sponge body. https://youtu.be/pTZ211cIjX8
The second crucial cells in sponges are called amoebocytes, named for the fact that they move throughout the mesohyl in an amoeba-like fashion. Amoebocytes have a variety of functions: delivering nutrients from choanocytes to other cells within the sponge, giving rise to eggs for sexual reproduction (which remain in the mesohyl), delivering phagocytized sperm from choanocytes to eggs, and differentiating into more-specific cell types. Some of these more specific cell types include collencytes and lophocytes, which produce the collagen-like protein to maintain the mesohyl, sclerocytes, which produce spicules in some sponges, and spongocytes, which produce the protein spongin in the majority of sponges. These cells produce collagen to maintain the consistency of the mesohyl.
Review Question:
Sponges
In some sponges, sclerocytes secrete small spicules into the mesohyl, which are composed of either calcium carbonate or silica, depending on the type of sponge. These spicules serve to provide additional stiffness to the body of the sponge. Additionally, spicules, when present externally, may ward off predators. Another type of protein, spongin, may also be present in the mesohyl of some sponges.
Physiological Processes in Sponges
Sponges, despite being simple organisms, regulate their different physiological processes through a variety of mechanisms. These processes regulate their metabolism, reproduction, and locomotion.
Digestion: Sponges lack complex digestive, respiratory, circulatory, reproductive, and nervous systems. Their food is trapped when water passes through the ostia and out through the osculum. Bacteria smaller than 0.5 microns in size are trapped by choanocytes, which are the principal cells engaged in nutrition, and are ingested by phagocytosis. Particles that are larger than the ostia may be phagocytized by pinacocytes. In some sponges, amoebocytes transport food from cells that have ingested food particles to those that do not. For this type of digestion, in which food particles are digested within individual cells, the sponge draws water through diffusion. The limit of this type of digestion is that food particles must be smaller than individual cells. All other major body functions in the sponge (gas exchange, circulation, excretion) are performed by diffusion between the cells that line the openings within the sponge and the water that is passing through those openings. All cell types within the sponge obtain oxygen from water through diffusion. Likewise, carbon dioxide is released into seawater by diffusion. In addition, nitrogenous waste produced as a byproduct of protein metabolism is excreted via diffusion by individual cells into the water as it passes through the sponge.
Reproduction: Sponges reproduce by sexual as well as asexual methods. The typical means of asexual reproduction is either fragmentation (where a piece of the sponge breaks off, settles on a new substrate, and develops into a new individual) or budding (a genetically identical outgrowth grows from the parent and eventually detaches or remains attached to form a colony). An atypical type of asexual reproduction is found only in freshwater sponges and occurs through the formation of gemmules. Gemmules are environmentally resistant structures produced by adult sponges wherein the typical sponge morphology is inverted. In gemmules, an inner layer of amoebocytes is surrounded by a layer of collagen (spongin) that may be reinforced by spicules. The collagen that is normally found in the mesohyl becomes the outer protective layer. In freshwater sponges, gemmules may survive hostile environmental conditions like changes in temperature and serve to recolonize the habitat once environmental conditions stabilize. Gemmules are capable of attaching to a substratum and generating a new sponge. Since gemmules can withstand harsh environments, are resistant to desiccation, and remain dormant for long periods, they are an excellent means of colonization for a sessile organism.
Sexual reproduction in sponges occurs when gametes are generated. Sponges are monoecious (hermaphroditic), which means that one individual can produce both gametes (eggs and sperm) simultaneously. In some sponges, the production of gametes may occur throughout the year, whereas other sponges may show sexual cycles depending upon water temperature. Sponges may also become sequentially hermaphroditic, producing oocytes first and spermatozoa later. Oocytes arise by the differentiation of amoebocytes and are retained within the spongocoel, whereas spermatozoa result from the differentiation of choanocytes and are ejected via the osculum. Ejection of spermatozoa may be a timed and coordinated event, as seen in certain species. Spermatozoa carried along by water currents can fertilize the oocytes borne in the mesohyl of other sponges. Early larval development occurs within the sponge, and free-swimming larvae are then released via the osculum.
Locomotion: Sponges are generally sessile as adults and spend their lives attached to a fixed substratum. They do not show movement over large distances like other free-swimming marine invertebrates. However, sponge cells are capable of creeping along substrata via organizational plasticity. Under experimental conditions, researchers have shown that sponge cells spread on physical support demonstrate a leading edge for directed movement. It has been speculated that this localized creeping movement may help sponges adjust to microenvironments near the point of attachment. It must be noted, however, that this pattern of movement has been documented in laboratories, but it remains to be observed in natural sponge habitats.
Phylum Cnidaria
The Phylum Cnidaria includes animals that show radial or biradial symmetry and are diploblastic, that is, they develop from two embryonic layers. Nearly all (about 99 percent) cnidarians are marine species.

Cnidarians contain specialized cells known as cnidocytes (“stinging cells”) with organelles called nematocysts that contain coiled threads that may bear barb (stingers) (Fig. 5). These cells are present around the mouth and tentacles. The outer wall of the cell has hairlike projections, which are sensitive to touch. When touched, the cells are known to fire coiled threads that can either penetrate the flesh of the prey or predators of cnidarians or ensnare it. These coiled threads release toxins into the target and can often immobilize prey or scare away predators.

Cnidarians display two distinct morphological body plans: polyp or “stalk” and medusa or “bell” (Fig. 6). An example of the polyp form is Hydra spp.; perhaps the most well-known medusoid animals are the jellies (jellyfish). Polyp forms are sessile as adults, with a single opening to the digestive system (the mouth) facing up with tentacles surrounding it. Medusa forms are motile, with the mouth and tentacles hanging down from an umbrella-shaped bell. Some cnidarians are polymorphic, that is, they have two body plans during their life cycle.
All cnidarians show the presence of two membrane layers in the body that are derived from the endoderm and ectoderm of the embryo. The outer layer (from ectoderm) is called the epidermis and lines the outside of the animal, whereas the inner layer (from endoderm) is called the gastrodermis and lines the digestive cavity. Between these two membrane layers is a non-living, jelly-like mesoglea connective layer. In terms of cellular complexity, cnidarians show the presence of differentiated cell types in each tissue layer, such as nerve cells, contractile epithelial cells, enzyme-secreting cells, and nutrient-absorbing cells, as well as the presence of intercellular connections. However, the development of organs or organ systems is not advanced in this phylum. The nervous system is primitive, with nerve cells scattered across the body.
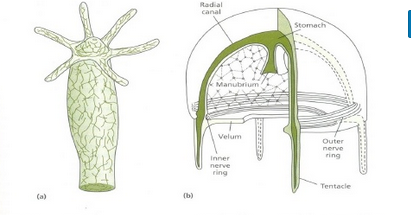
The nerve cells show mixed characteristics of motor as well as sensory neurons (Fig. 7). The predominant signaling molecules in these primitive nervous systems are chemical peptides, which perform both excitatory and inhibitory functions. Despite the simplicity of the nervous system, it coordinates the movement of tentacles, the drawing of captured prey to the mouth, the digestion of food, and the expulsion of waste.
The cnidarians perform extracellular digestion in which the food is taken into the gastrovascular cavity, enzymes are secreted into the cavity, and the cells lining the cavity absorb nutrients. The gastrovascular cavity has only one opening that serves as both a mouth and an anus, which is termed an incomplete digestive system.
Cnidarian cells exchange oxygen and carbon dioxide by diffusion between cells in the epidermis with water in the environment, and between cells in the gastrodermis with water in the gastrovascular cavity. The lack of a circulatory system to move dissolved gases limits the thickness of the body wall and necessitates a non-living mesoglea between the layers. There is no excretory system or organs, and nitrogenous wastes simply diffuse from the cells into the water outside the animal or in the gastrovascular cavity. There is also no circulatory system, so nutrients must move from the cells that absorb them in the lining of the gastrovascular cavity through the mesoglea to other cells.
Summary
Animals included in phylum Porifera are parazoans because they do not show the formation of true embryonically derived tissues, although they have a number of specific cell types and “functional” tissues such as pinacoderm. These organisms show very simple organization, with a rudimentary endoskeleton of spicules and spongin fibers. Glass sponge cells are connected together in a multinucleated syncytium. Although sponges are very simple in organization, they perform most of the physiological functions typical of more complex animals.
Cnidarians represent a more complex level of organization than Porifera. They possess outer and inner tissue layers that sandwich a noncellular mesoglea between them. Cnidarians possess a well-formed digestive system and carry out extracellular digestion in a digestive cavity that extends through much of the animal. The mouth is surrounded by tentacles that contain large numbers of cnidocytes—specialized cells bearing nematocysts used for stinging and capturing prey as well as discouraging predators. Cnidarians have separate sexes and many have a lifecycle that involves two distinct morphological forms—medusoid and polypoid—at various stages in their life cycles. In species with both forms, the medusa is the sexual, gamete-producing stage and the polyp is the asexual stage. Cnidarian species include individual or colonial polypoid forms, floating colonies, or large individual medusa forms (sea jellies).
End of Section Review Questions:
Review: Sponges
Review: Sponge amoebocytes
Review: Porifera vs Cnidaria
Learning Goals
By the end of this reading you should be able to:
- Describe the organizational features of the simplest multicellular animals
- Explain the various body forms and bodily functions of sponges
- Compare structural and organizational characteristics of Porifera and Cnidaria
- Describe the progressive development of tissues and their relevance to animal complexity
Introduction
Biologists strive to understand the evolutionary history and relationships of members of the animal kingdom, and all of life, for that matter. Currently, most biologists divide the animal kingdom into 35 to 40 phyla. The current understanding of evolutionary relationships between animal, or Metazoa, phyla begins with the distinction between “true” animals with true differentiated tissues, called Eumetazoa, and animal phyla that do not have true differentiated tissues (such as the sponges), called Parazoa. Both Parazoa and Eumetazoa evolved from a common ancestral organism that resembles the modern-day protists called choanoflagellates (choan - Greek for "funnel"). These protist cells strongly resemble the sponge choanocyte cells today (Fig. 1).
Eumetazoa is subdivided into radially symmetrical animals and bilaterally symmetrical animals, and are thus classified into the clades Bilateria or Radiata, respectively. Cnidarians and ctenophores are animal phyla with true radial symmetry. All other Eumetazoa are members of the Bilateria clade. The bilaterally symmetrical animals are further divided into deuterostomes (including chordates and echinoderms) and two distinct clades of protostomes (including ecdysozoans and lophotrochozoans). Ecdysozoa includes nematodes and arthropods (Fig. 2); they are so named for a commonly found characteristic among the group: exoskeletal molting (termed ecdysis). Lophotrochozoa is named for two structural features, each common to certain phyla within the clade. Some lophotrochozoan phyla are characterized by a larval stage called trochophore larvae, and other phyla are characterized by the presence of a feeding structure called a lophophore.
Phylum Porifera
The invertebrates (Invertebrata) are animals that do not contain bony structures, such as a cranium and vertebrae. The simplest of all invertebrate animals are the Parazoans, which include only the phylum Porifera: the sponges. Parazoans do not display tissue-level organization, although they do have specialized cells that perform specific functions. While the larvae of sponges are able to swim the adults are non-motile (sessile) and spend their life attached to a solid surface. Since water is vital to sponges for excretion, feeding, and gas exchange, their body structure facilitates the movement of water through the sponge. Structures such as canals, chambers, and cavities enable water to move through the sponge to nearly all body cells.
Morphology of Sponges
The morphology of the simplest sponges (Fig. 3) takes the shape of a cylinder with a large central cavity, the spongocoel, occupying the inside of the cylinder (Fig. 4). Water can enter into the spongocoel from numerous pores in the body wall. Water entering the spongocoel is expelled through a large common opening called the osculum. However, sponges exhibit a range of diversity in body forms, including variations in the size of the spongocoel, the number of osculi, and where the cells that filter food from the water are located. While sponges (excluding the hexactinellids) do not exhibit tissue-layer organization, they do have different cell types that perform distinct functions. Pinacocytes, which are epithelial-like cells, form the outermost layer of sponges and enclose a jelly-like substance called mesohyl. Mesohyl is an extracellular matrix consisting of a collagen-like gel with suspended cells that perform various functions. The gel-like consistency of mesohyl acts like an endoskeleton and maintains the tubular morphology of sponges. In addition to the osculum, sponges have multiple pores called ostia on their bodies that allow water to enter the sponge. In some sponges, ostia are formed by porocytes, single tube-shaped cells that act as valves to regulate the flow of water into the spongocoel. In other sponges, ostia are formed by folds in the body wall of the sponge. Choanocytes (“collar cells”) are present at various locations, depending on the type of sponge, but they always line the inner portions of some space through which water flows (the spongocoel in simple sponges, canals within the body wall in more complex sponges, and chambers scattered throughout the body in the most complex sponges). Whereas pinacocytes line the outside of the sponge, choanocytes tend to line certain inner portions of the sponge body that surround the mesohyl. The structure of a choanocyte is critical to its function, which is to generate a water current through the sponge and to trap and ingest food particles by phagocytosis. Note the similarity in appearance between the sponge choanocyte and choanoflagellates (Protista). This similarity suggests that sponges and choanoflagellates are closely related and likely share a recent common ancestry. The cell body is embedded in mesohyl and contains all organelles required for normal cell function, but protruding into the “open space” inside of the sponge is a mesh-like collar composed of microvilli with a single flagellum in the center of the column. The cumulative effect of the flagella from all choanocytes aids the movement of water through the sponge: drawing water into the sponge through the numerous ostia, into the spaces lined by choanocytes, and eventually out through the osculum (or osculi). In the meantime, food particles, including waterborne bacteria and algae, are trapped by the sieve-like collar of the choanocytes, slide down into the body of the cell, are ingested by phagocytosis, and become encased in a food vacuole. Lastly, choanocytes will differentiate into sperm for sexual reproduction, where they will become dislodged from the mesohyl and leave the sponge with expelled water through the osculum.
Watch this video to see the movement of water through the sponge body. https://youtu.be/pTZ211cIjX8
The second crucial cells in sponges are called amoebocytes, named for the fact that they move throughout the mesohyl in an amoeba-like fashion. Amoebocytes have a variety of functions: delivering nutrients from choanocytes to other cells within the sponge, giving rise to eggs for sexual reproduction (which remain in the mesohyl), delivering phagocytized sperm from choanocytes to eggs, and differentiating into more-specific cell types. Some of these more specific cell types include collencytes and lophocytes, which produce the collagen-like protein to maintain the mesohyl, sclerocytes, which produce spicules in some sponges, and spongocytes, which produce the protein spongin in the majority of sponges. These cells produce collagen to maintain the consistency of the mesohyl.
Review Question:
Sponges
In some sponges, sclerocytes secrete small spicules into the mesohyl, which are composed of either calcium carbonate or silica, depending on the type of sponge. These spicules serve to provide additional stiffness to the body of the sponge. Additionally, spicules, when present externally, may ward off predators. Another type of protein, spongin, may also be present in the mesohyl of some sponges.
Physiological Processes in Sponges
Sponges, despite being simple organisms, regulate their different physiological processes through a variety of mechanisms. These processes regulate their metabolism, reproduction, and locomotion.
Digestion: Sponges lack complex digestive, respiratory, circulatory, reproductive, and nervous systems. Their food is trapped when water passes through the ostia and out through the osculum. Bacteria smaller than 0.5 microns in size are trapped by choanocytes, which are the principal cells engaged in nutrition, and are ingested by phagocytosis. Particles that are larger than the ostia may be phagocytized by pinacocytes. In some sponges, amoebocytes transport food from cells that have ingested food particles to those that do not. For this type of digestion, in which food particles are digested within individual cells, the sponge draws water through diffusion. The limit of this type of digestion is that food particles must be smaller than individual cells. All other major body functions in the sponge (gas exchange, circulation, excretion) are performed by diffusion between the cells that line the openings within the sponge and the water that is passing through those openings. All cell types within the sponge obtain oxygen from water through diffusion. Likewise, carbon dioxide is released into seawater by diffusion. In addition, nitrogenous waste produced as a byproduct of protein metabolism is excreted via diffusion by individual cells into the water as it passes through the sponge.
Reproduction: Sponges reproduce by sexual as well as asexual methods. The typical means of asexual reproduction is either fragmentation (where a piece of the sponge breaks off, settles on a new substrate, and develops into a new individual) or budding (a genetically identical outgrowth grows from the parent and eventually detaches or remains attached to form a colony). An atypical type of asexual reproduction is found only in freshwater sponges and occurs through the formation of gemmules. Gemmules are environmentally resistant structures produced by adult sponges wherein the typical sponge morphology is inverted. In gemmules, an inner layer of amoebocytes is surrounded by a layer of collagen (spongin) that may be reinforced by spicules. The collagen that is normally found in the mesohyl becomes the outer protective layer. In freshwater sponges, gemmules may survive hostile environmental conditions like changes in temperature and serve to recolonize the habitat once environmental conditions stabilize. Gemmules are capable of attaching to a substratum and generating a new sponge. Since gemmules can withstand harsh environments, are resistant to desiccation, and remain dormant for long periods, they are an excellent means of colonization for a sessile organism.
Sexual reproduction in sponges occurs when gametes are generated. Sponges are monoecious (hermaphroditic), which means that one individual can produce both gametes (eggs and sperm) simultaneously. In some sponges, the production of gametes may occur throughout the year, whereas other sponges may show sexual cycles depending upon water temperature. Sponges may also become sequentially hermaphroditic, producing oocytes first and spermatozoa later. Oocytes arise by the differentiation of amoebocytes and are retained within the spongocoel, whereas spermatozoa result from the differentiation of choanocytes and are ejected via the osculum. Ejection of spermatozoa may be a timed and coordinated event, as seen in certain species. Spermatozoa carried along by water currents can fertilize the oocytes borne in the mesohyl of other sponges. Early larval development occurs within the sponge, and free-swimming larvae are then released via the osculum.
Locomotion: Sponges are generally sessile as adults and spend their lives attached to a fixed substratum. They do not show movement over large distances like other free-swimming marine invertebrates. However, sponge cells are capable of creeping along substrata via organizational plasticity. Under experimental conditions, researchers have shown that sponge cells spread on physical support demonstrate a leading edge for directed movement. It has been speculated that this localized creeping movement may help sponges adjust to microenvironments near the point of attachment. It must be noted, however, that this pattern of movement has been documented in laboratories, but it remains to be observed in natural sponge habitats.
Phylum Cnidaria
The Phylum Cnidaria includes animals that show radial or biradial symmetry and are diploblastic, that is, they develop from two embryonic layers. Nearly all (about 99 percent) cnidarians are marine species.
Cnidarians contain specialized cells known as cnidocytes (“stinging cells”) with organelles called nematocysts that contain coiled threads that may bear barb (stingers) (Fig. 5). These cells are present around the mouth and tentacles. The outer wall of the cell has hairlike projections, which are sensitive to touch. When touched, the cells are known to fire coiled threads that can either penetrate the flesh of the prey or predators of cnidarians or ensnare it. These coiled threads release toxins into the target and can often immobilize prey or scare away predators.
Cnidarians display two distinct morphological body plans: polyp or “stalk” and medusa or “bell” (Fig. 6). An example of the polyp form is Hydra spp.; perhaps the most well-known medusoid animals are the jellies (jellyfish). Polyp forms are sessile as adults, with a single opening to the digestive system (the mouth) facing up with tentacles surrounding it. Medusa forms are motile, with the mouth and tentacles hanging down from an umbrella-shaped bell. Some cnidarians are polymorphic, that is, they have two body plans during their life cycle.
All cnidarians show the presence of two membrane layers in the body that are derived from the endoderm and ectoderm of the embryo. The outer layer (from ectoderm) is called the epidermis and lines the outside of the animal, whereas the inner layer (from endoderm) is called the gastrodermis and lines the digestive cavity. Between these two membrane layers is a non-living, jelly-like mesoglea connective layer. In terms of cellular complexity, cnidarians show the presence of differentiated cell types in each tissue layer, such as nerve cells, contractile epithelial cells, enzyme-secreting cells, and nutrient-absorbing cells, as well as the presence of intercellular connections. However, the development of organs or organ systems is not advanced in this phylum. The nervous system is primitive, with nerve cells scattered across the body.
The nerve cells show mixed characteristics of motor as well as sensory neurons (Fig. 7). The predominant signaling molecules in these primitive nervous systems are chemical peptides, which perform both excitatory and inhibitory functions. Despite the simplicity of the nervous system, it coordinates the movement of tentacles, the drawing of captured prey to the mouth, the digestion of food, and the expulsion of waste.
The cnidarians perform extracellular digestion in which the food is taken into the gastrovascular cavity, enzymes are secreted into the cavity, and the cells lining the cavity absorb nutrients. The gastrovascular cavity has only one opening that serves as both a mouth and an anus, which is termed an incomplete digestive system.
Cnidarian cells exchange oxygen and carbon dioxide by diffusion between cells in the epidermis with water in the environment, and between cells in the gastrodermis with water in the gastrovascular cavity. The lack of a circulatory system to move dissolved gases limits the thickness of the body wall and necessitates a non-living mesoglea between the layers. There is no excretory system or organs, and nitrogenous wastes simply diffuse from the cells into the water outside the animal or in the gastrovascular cavity. There is also no circulatory system, so nutrients must move from the cells that absorb them in the lining of the gastrovascular cavity through the mesoglea to other cells.
Summary
Animals included in phylum Porifera are parazoans because they do not show the formation of true embryonically derived tissues, although they have a number of specific cell types and “functional” tissues such as pinacoderm. These organisms show very simple organization, with a rudimentary endoskeleton of spicules and spongin fibers. Glass sponge cells are connected together in a multinucleated syncytium. Although sponges are very simple in organization, they perform most of the physiological functions typical of more complex animals.
Cnidarians represent a more complex level of organization than Porifera. They possess outer and inner tissue layers that sandwich a noncellular mesoglea between them. Cnidarians possess a well-formed digestive system and carry out extracellular digestion in a digestive cavity that extends through much of the animal. The mouth is surrounded by tentacles that contain large numbers of cnidocytes—specialized cells bearing nematocysts used for stinging and capturing prey as well as discouraging predators. Cnidarians have separate sexes and many have a lifecycle that involves two distinct morphological forms—medusoid and polypoid—at various stages in their life cycles. In species with both forms, the medusa is the sexual, gamete-producing stage and the polyp is the asexual stage. Cnidarian species include individual or colonial polypoid forms, floating colonies, or large individual medusa forms (sea jellies).
End of Section Review Questions:
Review: Sponges
Review: Sponge amoebocytes
Review: Porifera vs Cnidaria
Learning Goals
- List and describe the functions of the structural components of a neuron
- List and describe the four main types of neurons
- Compare the functions of different types of glial cells
Introduction
When you’re reading this, your nervous system is performing several functions simultaneously. The visual system is processing what is seen on the page; the motor system controls the turn of the pages (or click of the mouse); the prefrontal cortex maintains attention. Even fundamental functions, like breathing and regulation of body temperature, are controlled by the nervous system. A nervous system is an organism’s control center: it processes sensory information from outside (and inside) the body and controls all behaviors—from eating to sleeping to finding a mate.
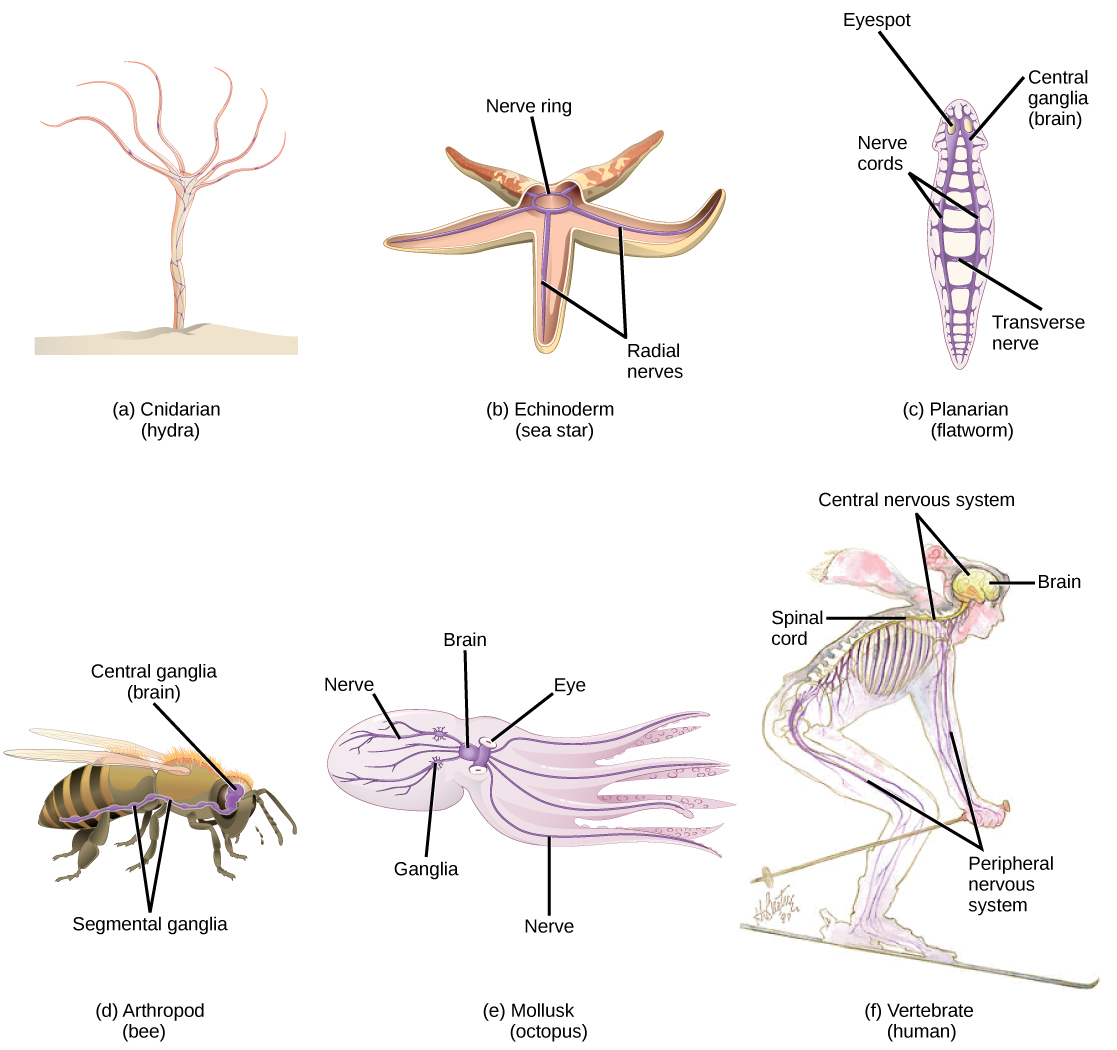
Nervous systems throughout the animal kingdom vary in structure and complexity, as illustrated by the variety of animals shown in Figure 1. Some organisms, like sea sponges, lack a true nervous system. Others, like jellyfish, lack a true brain and instead have a system of separate but connected nerve cells (neurons) called a “nerve net.” Regardless of the animal, the nervous system is made up of neurons, specialized cells that can receive and transmit chemical or electrical signals, and glia, cells that provide support functions for the neurons by playing an information processing role that is complementary to neurons. A neuron can be compared to an electrical wire—it transmits a signal from one place to another. Glia can be compared to the workers at the electric company who make sure wires go to the right places, maintain the wires, and take down wires that are broken. Although glia have been compared to workers, recent evidence suggests that also usurp some of the signaling functions of neurons. There is great diversity in the types of neurons and glia that are present in different parts of the nervous system.
Neurons
The nervous system of the common laboratory fly, Drosophila melanogaster, contains around 100,000 neurons, the same number as a lobster. This number compares to 75 million in the mouse and 300 million in the octopus. A human brain contains around 86 billion neurons. Despite these very different numbers, the nervous systems of these animals control many of the same behaviors—from basic reflexes to more complicated behaviors like finding food and courting mates. The ability of neurons to communicate with each other as well as with other types of cells underlies all of these behaviors. Most neurons share the same cellular components. But neurons are also highly specialized—different types of neurons have different sizes and shapes that relate to their functional roles.
Parts of a Neuron
Like other cells, each neuron has a cell body (or soma) that contains a nucleus, smooth and rough endoplasmic reticulum, Golgi apparatus, mitochondria, and other cellular components. Neurons also contain unique structures, for receiving and sending the electrical signals that make neuronal communication possible. Dendrites are tree-like structures that extend away from the cell body to receive messages from other neurons at specialized junctions called synapses. Although some neurons do not have any dendrites, some types of neurons have multiple dendrites. Dendrites can have small protrusions called dendritic spines, which further increase surface area for possible synaptic connections.
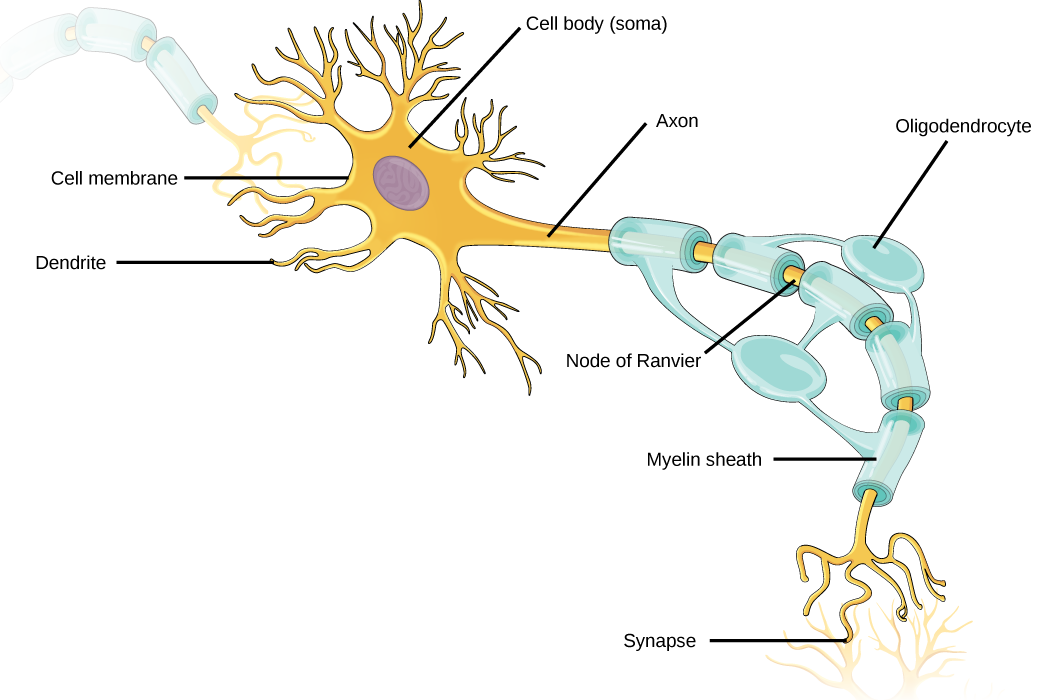
Once a signal is received by the dendrite, it then travels passively to the cell body. The cell body contains a specialized structure, the axon hillock that integrates signals from multiple synapses and serves as a junction between the cell body and an axon. An axon is a tube-like structure that propagates the integrated signal to specialized endings called axon terminals. These terminals in turn synapse on other neurons, muscles, or target organs. Chemicals released at axon terminals allow signals to be communicated to these other cells. Neurons usually have one or two axons, but some neurons, like amacrine cells in the retina, do not contain any axons. Some axons are covered with myelin, which acts as an insulator to minimize the dissipation of the electrical signal as it travels down the axon, greatly increasing the speed of conduction. This insulation is important as the axon from a human motor neuron can be as long as a meter—from the base of the spine to the toes. The myelin sheath is not actually part of the neuron. Myelin is produced by glial cells. Along the axon, there are periodic gaps in the myelin sheath. These gaps are sites where the signal is “recharged” as it travels along the axon.
It is important to note that a single neuron does not act alone—neuronal communication depends on the connections that neurons make with one another (as well as with other cells, like muscle cells). Dendrites from a single neuron may receive synaptic contact from many other neurons. For example, dendrites from a Purkinje cell in the cerebellum are thought to receive contact from as many as 200,000 other neurons.
Review Question:
Types of Neurons
There are four different types of neurons, and the functional role of a given neuron is intimately dependent on its structure. There is an amazing diversity of neuron shapes and sizes found in different parts of the nervous system (and across species).
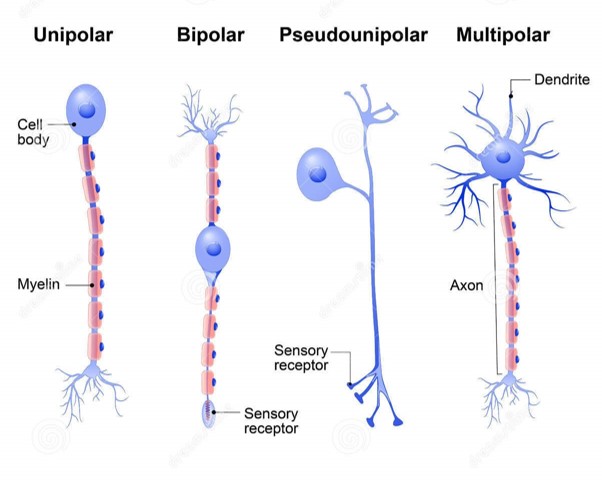
While there are many defined neuron cell subtypes, neurons are broadly divided into four basic types: unipolar, bipolar, multipolar, and pseudounipolar. Unipolar neurons have only one structure that extends away from the soma. These neurons are not found in vertebrates but are found in insects where they stimulate muscles or glands. A bipolar neuron has one axon and one dendrite extending from the soma. An example of a bipolar neuron is a retinal bipolar cell, which receives signals from photoreceptor cells that are sensitive to light and transmits these signals to ganglion cells that carry the signal to the brain. Multipolar neurons are the most common type of neuron. Each multipolar neuron contains one axon and multiple dendrites. Multipolar neurons can be found in the central nervous system (brain and spinal cord). An example of a multipolar neuron is a Purkinje cell in the cerebellum, which has many branching dendrites but only one axon. Pseudounipolar cells share characteristics with both unipolar and bipolar cells. A pseudounipolar cell has a single process that extends from the soma, like a unipolar cell, but this process later branches into two distinct structures, like a bipolar cell. Most sensory neurons are pseudounipolar and have an axon that branches into two extensions: one connected to dendrites that receive sensory information and another that transmits this information to the spinal cord.
Neurogenesis: At one time, scientists believed that people were born with all the neurons they would ever have. Research performed during the last few decades indicates that neurogenesis, the birth of new neurons, continues into adulthood. Neurogenesis was first discovered in songbirds that produce new neurons while learning songs. For mammals, new neurons also play an important role in learning: about 1000 new neurons develop in the hippocampus (a brain structure involved in learning and memory) each day. While most of the new neurons will die, researchers found that an increase in the number of surviving new neurons in the hippocampus correlated with how well rats learned a new task. Interestingly, both exercise and some antidepressant medications also promote neurogenesis in the hippocampus. Stress has the opposite effect. While neurogenesis is quite limited compared to regeneration in other tissues, research in this area may lead to new treatments for disorders such as Alzheimer’s, stroke, and epilepsy
Glia
While glia are often thought of as the supporting cast of the nervous system, the number of glial cells in the brain actually outnumbers the number of neurons by a factor of ten. Neurons would be unable to function without the vital roles that are fulfilled by these glial cells. Glia guide developing neurons to their destinations, buffer ions and chemicals that would otherwise harm neurons and provide myelin sheaths around axons. Scientists have recently discovered that they also play a role in responding to nerve activity and modulating communication between nerve cells. When glia do not function properly, the result can be disastrous—most brain tumors are caused by mutations in glia.
Types of Glia
Each type of glial cell has different functions and thus different interactions with the nervous system:
- Astrocytes make contact with both capillaries and neurons in the CNS. They provide nutrients and other substances to neurons, regulate the concentrations of ions and chemicals in the extracellular fluid, and provide structural support for synapses. Astrocytes also form the blood-brain barrier—a structure that blocks entrance of toxic substances into the brain. Astrocytes become active in response to nerve activity, transmit calcium waves between neurons, and modulate the activity of surrounding synapses.
- Satellite glia provide nutrients and structural support for neurons in the peripheral nervous system (PNS).
- Microglia scavenge and degrade dead cells and protect the brain from invading microorganisms.
- Oligodendrocytes form myelin sheaths around axons in the central nervous system (CNS). One axon can be myelinated by several oligodendrocytes, and one oligodendrocyte can provide myelin for multiple neurons.
- Schwan cells form myelin sheaths around axons in the PNS where a single Schwann cell provides myelin for only one axon as the entire Schwann cell surrounds the axon.
- Radial glia give rise to new neurons (neurogenesis) and serve as scaffolds for developing neurons as they migrate to their end destinations.
- Ependymal cells line fluid-filled ventricles of the brain and the central canal of the spinal cord. They are involved in the production of cerebrospinal fluid, which serves as a cushion for the brain, moves the fluid between the spinal cord and the brain, and is a component for the choroid plexus.
This quick two-minute video reviews the functions of the different types of glial cells. https://youtu.be/AwES6R1_9PM
B) Oligodendrocytes
Summary
The nervous system is made up of neurons and glia. Neurons are specialized cells that are capable of sending electrical as well as chemical signals. Most neurons contain dendrites, which receive these signals, and axons that send signals to other neurons or tissues. There are four main types of neurons: unipolar, bipolar, multipolar, and pseudounipolar neurons. Glia are non-neuronal cells in the nervous system that support neuronal development and signaling. There are several types of glia that serve different functions.
End of Section Review Questions:
Review: Neuron types
 neuron has one axon and one dendrite extending directly from the cell body.
Review: Glial cell functions
4) How are neurons similar to other cells? How are they unique?
Learning Goals
- List and describe the functions of the structural components of a neuron
- List and describe the four main types of neurons
- Compare the functions of different types of glial cells
Introduction
When you’re reading this, your nervous system is performing several functions simultaneously. The visual system is processing what is seen on the page; the motor system controls the turn of the pages (or click of the mouse); the prefrontal cortex maintains attention. Even fundamental functions, like breathing and regulation of body temperature, are controlled by the nervous system. A nervous system is an organism’s control center: it processes sensory information from outside (and inside) the body and controls all behaviors—from eating to sleeping to finding a mate.
Nervous systems throughout the animal kingdom vary in structure and complexity, as illustrated by the variety of animals shown in Figure 1. Some organisms, like sea sponges, lack a true nervous system. Others, like jellyfish, lack a true brain and instead have a system of separate but connected nerve cells (neurons) called a “nerve net.” Regardless of the animal, the nervous system is made up of neurons, specialized cells that can receive and transmit chemical or electrical signals, and glia, cells that provide support functions for the neurons by playing an information processing role that is complementary to neurons. A neuron can be compared to an electrical wire—it transmits a signal from one place to another. Glia can be compared to the workers at the electric company who make sure wires go to the right places, maintain the wires, and take down wires that are broken. Although glia have been compared to workers, recent evidence suggests that also usurp some of the signaling functions of neurons. There is great diversity in the types of neurons and glia that are present in different parts of the nervous system.
Neurons
The nervous system of the common laboratory fly, Drosophila melanogaster, contains around 100,000 neurons, the same number as a lobster. This number compares to 75 million in the mouse and 300 million in the octopus. A human brain contains around 86 billion neurons. Despite these very different numbers, the nervous systems of these animals control many of the same behaviors—from basic reflexes to more complicated behaviors like finding food and courting mates. The ability of neurons to communicate with each other as well as with other types of cells underlies all of these behaviors. Most neurons share the same cellular components. But neurons are also highly specialized—different types of neurons have different sizes and shapes that relate to their functional roles.
Parts of a Neuron
Like other cells, each neuron has a cell body (or soma) that contains a nucleus, smooth and rough endoplasmic reticulum, Golgi apparatus, mitochondria, and other cellular components. Neurons also contain unique structures, for receiving and sending the electrical signals that make neuronal communication possible. Dendrites are tree-like structures that extend away from the cell body to receive messages from other neurons at specialized junctions called synapses. Although some neurons do not have any dendrites, some types of neurons have multiple dendrites. Dendrites can have small protrusions called dendritic spines, which further increase surface area for possible synaptic connections.
Once a signal is received by the dendrite, it then travels passively to the cell body. The cell body contains a specialized structure, the axon hillock that integrates signals from multiple synapses and serves as a junction between the cell body and an axon. An axon is a tube-like structure that propagates the integrated signal to specialized endings called axon terminals. These terminals in turn synapse on other neurons, muscles, or target organs. Chemicals released at axon terminals allow signals to be communicated to these other cells. Neurons usually have one or two axons, but some neurons, like amacrine cells in the retina, do not contain any axons. Some axons are covered with myelin, which acts as an insulator to minimize the dissipation of the electrical signal as it travels down the axon, greatly increasing the speed of conduction. This insulation is important as the axon from a human motor neuron can be as long as a meter—from the base of the spine to the toes. The myelin sheath is not actually part of the neuron. Myelin is produced by glial cells. Along the axon, there are periodic gaps in the myelin sheath. These gaps are sites where the signal is “recharged” as it travels along the axon.
It is important to note that a single neuron does not act alone—neuronal communication depends on the connections that neurons make with one another (as well as with other cells, like muscle cells). Dendrites from a single neuron may receive synaptic contact from many other neurons. For example, dendrites from a Purkinje cell in the cerebellum are thought to receive contact from as many as 200,000 other neurons.
Review Question:
Types of Neurons
There are four different types of neurons, and the functional role of a given neuron is intimately dependent on its structure. There is an amazing diversity of neuron shapes and sizes found in different parts of the nervous system (and across species).
While there are many defined neuron cell subtypes, neurons are broadly divided into four basic types: unipolar, bipolar, multipolar, and pseudounipolar. Unipolar neurons have only one structure that extends away from the soma. These neurons are not found in vertebrates but are found in insects where they stimulate muscles or glands. A bipolar neuron has one axon and one dendrite extending from the soma. An example of a bipolar neuron is a retinal bipolar cell, which receives signals from photoreceptor cells that are sensitive to light and transmits these signals to ganglion cells that carry the signal to the brain. Multipolar neurons are the most common type of neuron. Each multipolar neuron contains one axon and multiple dendrites. Multipolar neurons can be found in the central nervous system (brain and spinal cord). An example of a multipolar neuron is a Purkinje cell in the cerebellum, which has many branching dendrites but only one axon. Pseudounipolar cells share characteristics with both unipolar and bipolar cells. A pseudounipolar cell has a single process that extends from the soma, like a unipolar cell, but this process later branches into two distinct structures, like a bipolar cell. Most sensory neurons are pseudounipolar and have an axon that branches into two extensions: one connected to dendrites that receive sensory information and another that transmits this information to the spinal cord.
Neurogenesis: At one time, scientists believed that people were born with all the neurons they would ever have. Research performed during the last few decades indicates that neurogenesis, the birth of new neurons, continues into adulthood. Neurogenesis was first discovered in songbirds that produce new neurons while learning songs. For mammals, new neurons also play an important role in learning: about 1000 new neurons develop in the hippocampus (a brain structure involved in learning and memory) each day. While most of the new neurons will die, researchers found that an increase in the number of surviving new neurons in the hippocampus correlated with how well rats learned a new task. Interestingly, both exercise and some antidepressant medications also promote neurogenesis in the hippocampus. Stress has the opposite effect. While neurogenesis is quite limited compared to regeneration in other tissues, research in this area may lead to new treatments for disorders such as Alzheimer’s, stroke, and epilepsy
Glia
While glia are often thought of as the supporting cast of the nervous system, the number of glial cells in the brain actually outnumbers the number of neurons by a factor of ten. Neurons would be unable to function without the vital roles that are fulfilled by these glial cells. Glia guide developing neurons to their destinations, buffer ions and chemicals that would otherwise harm neurons and provide myelin sheaths around axons. Scientists have recently discovered that they also play a role in responding to nerve activity and modulating communication between nerve cells. When glia do not function properly, the result can be disastrous—most brain tumors are caused by mutations in glia.
Types of Glia
Each type of glial cell has different functions and thus different interactions with the nervous system:
- Astrocytes make contact with both capillaries and neurons in the CNS. They provide nutrients and other substances to neurons, regulate the concentrations of ions and chemicals in the extracellular fluid, and provide structural support for synapses. Astrocytes also form the blood-brain barrier—a structure that blocks entrance of toxic substances into the brain. Astrocytes become active in response to nerve activity, transmit calcium waves between neurons, and modulate the activity of surrounding synapses.
- Satellite glia provide nutrients and structural support for neurons in the peripheral nervous system (PNS).
- Microglia scavenge and degrade dead cells and protect the brain from invading microorganisms.
- Oligodendrocytes form myelin sheaths around axons in the central nervous system (CNS). One axon can be myelinated by several oligodendrocytes, and one oligodendrocyte can provide myelin for multiple neurons.
- Schwan cells form myelin sheaths around axons in the PNS where a single Schwann cell provides myelin for only one axon as the entire Schwann cell surrounds the axon.
- Radial glia give rise to new neurons (neurogenesis) and serve as scaffolds for developing neurons as they migrate to their end destinations.
- Ependymal cells line fluid-filled ventricles of the brain and the central canal of the spinal cord. They are involved in the production of cerebrospinal fluid, which serves as a cushion for the brain, moves the fluid between the spinal cord and the brain, and is a component for the choroid plexus.
This quick two-minute video reviews the functions of the different types of glial cells. https://youtu.be/AwES6R1_9PM
B) Oligodendrocytes
Summary
The nervous system is made up of neurons and glia. Neurons are specialized cells that are capable of sending electrical as well as chemical signals. Most neurons contain dendrites, which receive these signals, and axons that send signals to other neurons or tissues. There are four main types of neurons: unipolar, bipolar, multipolar, and pseudounipolar neurons. Glia are non-neuronal cells in the nervous system that support neuronal development and signaling. There are several types of glia that serve different functions.
End of Section Review Questions:
Review: Neuron types
neuron has one axon and one dendrite extending directly from the cell body.Review: Glial cell functions
4) How are neurons similar to other cells? How are they unique?
Learning Goals
By the end of this reading you should be able to:
- Differentiate between different types of skeletons and give examples of organisms with each type
- Describe the advantages and disadvantages of each type of skeleton
Introduction
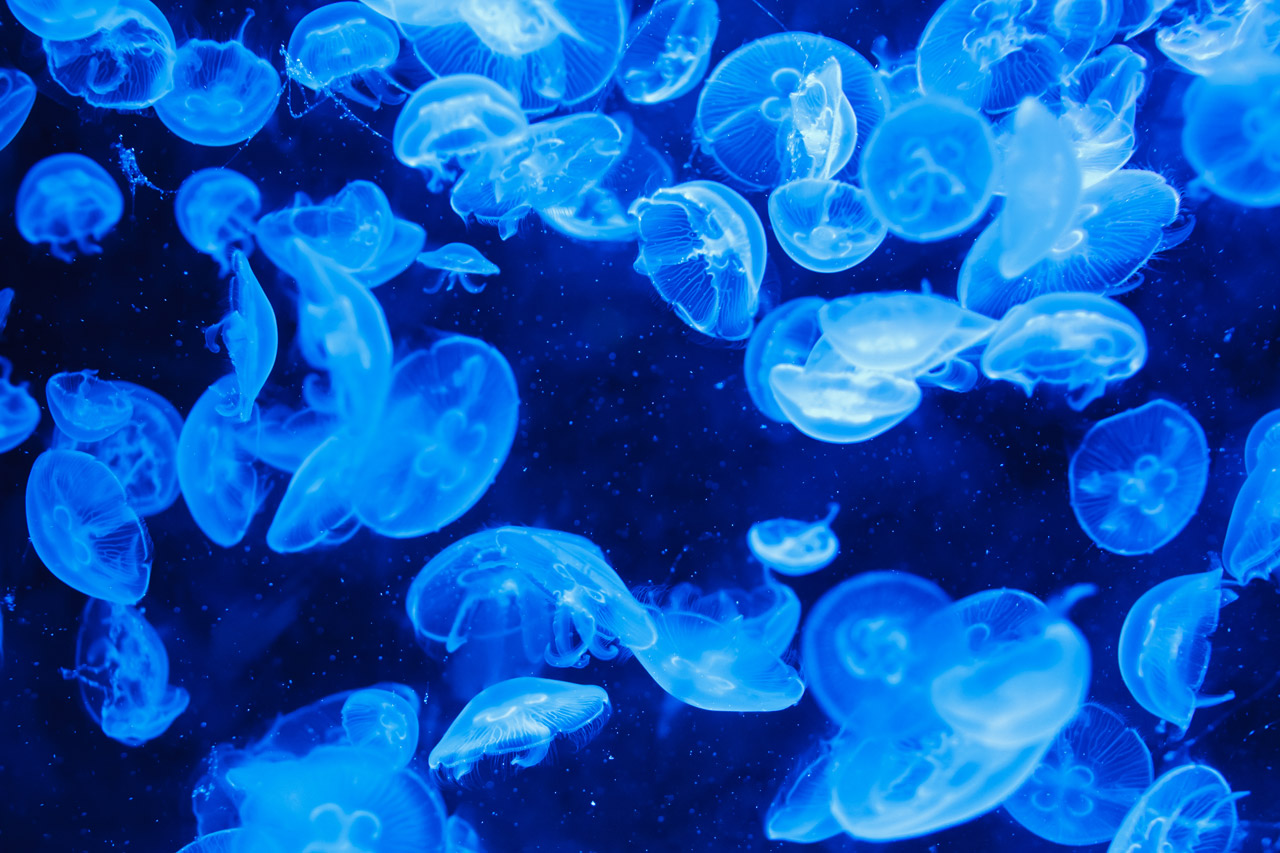
The earliest forms of life evolved in the oceans. The fact that this is an aquatic environment is key. Water is about 1,000 times denser than air. The high density of water allows organisms to float, due to a physical, upward force inherent in liquids known as buoyancy. Buoyancy allowed organisms to grow and reach large sizes because the buoyancy force supported the bodyweight of these animals. However, the density of water also provides resistance to movement, and animals had to adapt to ensure that they were able to move efficiently through the water.
An early adaptation by organisms was the ability to change the hydrostatic pressure within different chambers of their bodies to enable quick movement. This resulted in the development of hydrostatic skeletons. Animals with this type of skeleton include jellyfish, octopuses, and sea anemones. The changing shape of the animal reduces both friction and drag.
Over time, in order to refine movement and improve protection from predators, some organisms developed a hard chitinous exoskeleton. Exoskeletons first developed in the aquatic environment in ancient arthropods. Animals with this type of skeleton include crustaceans like crabs and lobsters.
Eventually, there were some animals that developed a skeletal structure internal to the body, which would become the vertebrate group of animals. These animals have an endoskeleton. Initially, all endoskeletons were made of cartilage, which is a dense rubbery type of tissue. Later, endoskeletons of bone evolved.
Hydrostatic Skeletons
A hydrostatic skeleton is a structure found in many cold-blooded and soft-bodied organisms. It consists of a fluid-filled cavity, which is surrounded by muscles. The cavity is called a coelom and in some animals, this cavity is filled with a blood-like substance called haemocoel. The fluid presses against the muscles, which in turn contract against the pressure of the fluid. The fluid is incompressible and thus maintains a constant volume against which the muscles can contract. The hydrostatic skeleton prevents the collapse of the body. The muscles in the body act against the fluid and in doing so bring about movement. If the body is segmented, the pressure of the fluid is localised in a few segments at a time. Hydrostatic skeletons occur in flatworms, roundworms, earthworms, starfish and slugs.
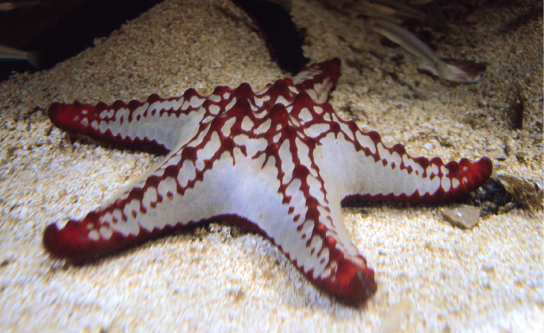
Movement in a hydrostatic skeleton is provided by muscles that surround the coelom. The muscles in a hydrostatic skeleton contract to change the shape of the coelom; the pressure of the fluid in the coelom produces movement. For example, earthworms move by waves of muscular contractions of the skeletal muscle of the body wall hydrostatic skeleton, called peristalsis, which alternately shorten and lengthen the body. Lengthening the body extends the anterior end of the organism. Most organisms have a mechanism to fix themselves in the substrate. Shortening the muscles then draws the posterior portion of the body forward. Although a hydrostatic skeleton is well-suited to invertebrate organisms such as earthworms and some aquatic organisms, it is not an efficient skeleton for terrestrial animals.
Advantages of a hydrostatic skeleton
- Fluid shape: This allows organisms with hydrostatic skeletons to fit through oddly shaped passages, which is useful for burrowing or swimming.
- Strength: Creatures with hydrostatic skeletons can squeeze between spaces and expand, making a 'prying open' movement which allows them to force their way into various regions of rock and soil surfaces.
- Healing: Healing takes place faster in organisms with hydrostatic skeletons than in organisms with bone structures. This is because the haemocoel contained within the hydrostatic skeleton is made up mostly of water, and thus, can be refilled quickly. This allows many organisms with hydrostatic skeletons such as earthworms to grow back their body mass after damage.
- Lightweight: The hydrostatic skeleton allows the animal to move in a more flexible manner as it requires very little muscle mass for movement.
- Circulation: The fluid cavity allows the circulation of nutrients and waste.
- Protection: The hydrostatic skeletons cushions the internal organs of the animal from shock.
- Suited to the environment: Hydrostatic skeletons are suited for life in moist or aquatic environments, depending on the animal's adaptations.
Disadvantages of a hydrostatic skeleton
- Structure and surface for attachment: The hydrostatic skeleton lacks a structure and does not have surfaces for the attachment of muscles or limbs.
- Lack of protection: There is very little protection for the internal organs.
- Desiccation: A moist or water habitat is essential for the survival of these animals in order to prevent desiccation (drying out).
- Limited strength: Terrestrial animals with hydrostatic skeletons cannot increase their body size as they would collapse under their own body weight.
Review Question:
Exoskeletons
An exoskeleton is an external skeleton that supports and protects an animal's body. The skeleton is non-living and consists of a cuticle strengthened by chitin, a substance secreted by the epidermis (skin). Crustaceans such as crabs have their exoskeleton further strengthened by calcium carbonate. There are muscles attached to the inside of the exoskeleton which provides the resistance needed for muscle action.
This skeleton-type provides defence against predators, supports the body, and allows for movement through the contraction of attached muscles. As with vertebrates, muscles must cross a joint inside the exoskeleton. Shortening of the muscle changes the relationship of the two segments of the exoskeleton. Arthropods such as crabs and lobsters have exoskeletons that consist of 30–50 per cent chitin, a polysaccharide derivative of glucose that is a strong but flexible material. Chitin is secreted by the epidermal cells. The exoskeleton is further strengthened by the addition of calcium carbonate in organisms such as the lobster. Because the exoskeleton is acellular, arthropods must periodically shed their exoskeletons because the exoskeleton does not grow as the organism grows.
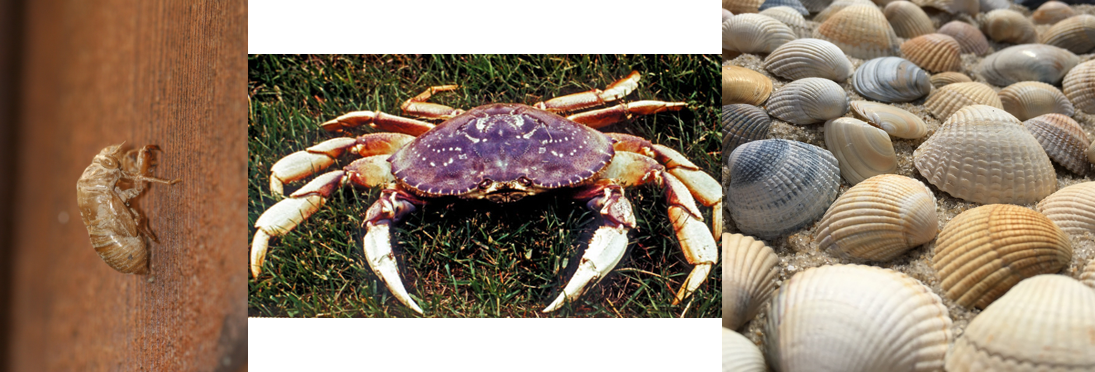
The exoskeleton is confined to animals such as insects, spiders, scorpions, crabs etc., all of which belong to the Phylum Arthropoda (jointed-legged and jointed-bodied animals). The exoskeleton acts as a hard outer covering and is made up of a series of plates or tubes. We often call large exoskeletons `shells'.
Advantages of the exoskeleton
- Muscle attachment: The exoskeleton forms the point of attachment of internal muscles needed for locomotion thereby providing better leverage for muscle action.
- Protection: The exoskeleton protects the soft internal tissues and organs.
- Support: The exoskeleton provides structural support and shape.
- Prevents Desiccation: The exoskeleton prevents desiccation (drying out) on land.
- Light-weight: The exoskeleton of insects has a low density and is therefore lightweight, to allow for flight.
- Diversity: The mouth-parts can be modified for biting, sucking, piercing grasping thus providing for a diversified diet for organisms possessing an exoskeleton compared to those that do not.
Disadvantages of the exoskeleton
- Size restriction: The final body size is limited because as the body size increases, the surface area to volume ratio decreases. The larger the animal, the heavier the exoskeleton, making movement more difficult.
- The non-living skeleton does not grow with animals: The overall growth of the animal is restricted due to periodic moulting. Since the exoskeleton restricts growth, moulting is required to accommodate for increases in the size of the animal.
- Vulnerability during moulting: The animal is vulnerable when it is in the moulting process because the new skeleton is very soft until the new exoskeleton has dried and hardened.
- Sites of structural weakness: Exoskeletons are weaker at the joints.
Endoskeletons
An endoskeleton is a skeleton that consists of hard, mineralized structures located within the soft tissue of organisms. The bones of vertebrates are composed of tissues and can consist of bone (all vertebrates except sharks) or cartilage (sharks) and some endoskeletons consist of both. Endoskeletons provide support for the body, protect internal organs, and allow for movement through the contraction of muscles attached to the skeleton.

Advantages of the endoskeleton
- Living: Endoskeletons consist of living tissue, so it is able to grow steadily within the animal enabling some to reach a large size.
- Structure and support: The endoskeleton provides shape and structural support.
- Structural diversity and adaptation: The bones can vary in size and shape to support the animal's mass.
- Flexible: The endoskeleton is jointed which allows for flexible movement and support.
- Muscle attachment: The muscles attach directly to the skeletal bones to allow for movement and support.
- Protection: The endoskeleton protects the vital organs such as the heart and lungs which are protected by the ribcage.
- Diversified locomotion: The development of an endoskeleton has allowed animals to become successfully adapted to locomotion in the environment in which they live. Vertebrates (organisms with a vertebral column and an endoskeleton) have become adapted to move in a number of different modes of locomotion, e.g. running, jumping, swimming, and flying.
Disadvantages of the endoskeleton
- Vulnerable to the external environment: The endoskeleton does not offer the animal any protection from the exterior, be it a physical attack or changes in environmental conditions. The animal is therefore very vulnerable.
- Susceptible to disease: The skeleton consists of living tissue so is susceptible to infections and disease.
Summary
The three types of skeleton designs are hydrostatic skeletons, exoskeletons, and endoskeletons. A hydrostatic skeleton is formed by a fluid-filled compartment held under hydrostatic pressure; movement is created by the muscles producing pressure on the fluid. An exoskeleton is a hard external skeleton that protects the outer surface of an organism and enables movement through muscles attached to the inside. An endoskeleton is an internal skeleton composed of hard, mineralized tissue that also enables movement by attachment to muscles.
REVIEW: Endo vs. Exoskeletons
REVIEW: Exoskeletons
3) As animals evolved to live on land they didn't all adapt their skeletons in the same way. In a terrestrial environment what are the advantages of an exoskeleton? What about an endoskeleton?
References
Learning Goals
By the end of this reading you should be able to:
- Describe the different types of muscle tissue
- Draw the basic structure of a skeletal muscle fiber
- Explain the sliding filament model of muscle contraction
- Describe the factors that control muscle tension
Introduction
Muscle cells are specialized for contraction. Muscles allow for motions such as walking, and they also facilitate bodily processes such as respiration and digestion. The body contains three types of muscle tissue: skeletal muscle, cardiac muscle, and smooth muscle.
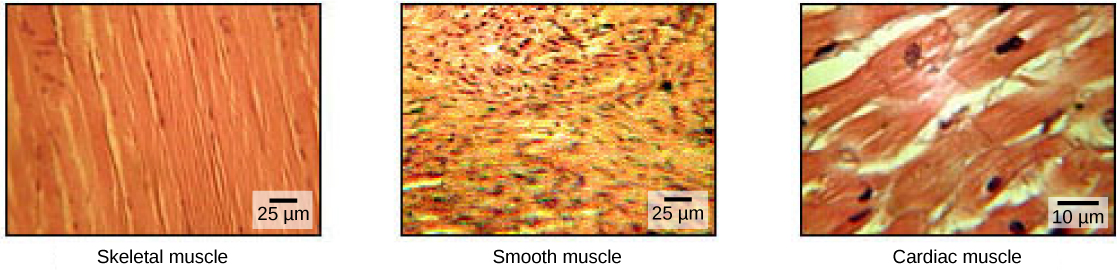
Skeletal muscle tissue forms skeletal muscles, which attach to bones or skin and control locomotion and any movement that can be consciously controlled. Because it can be controlled by thought, skeletal muscle is also called voluntary muscle. Skeletal muscles are long and cylindrical in appearance; when viewed under a microscope, skeletal muscle tissue has a striped or striated appearance. The striations are caused by the regular arrangement of contractile proteins (actin and myosin). Actin is a globular contractile protein that interacts with myosin for muscle contraction. Skeletal muscle also has multiple nuclei present in a single cell.
Smooth muscle tissue occurs in the walls of hollow organs such as the intestines, stomach, and urinary bladder, and around passages such as the respiratory tract and blood vessels. Smooth muscle has no striations, is not under voluntary control, has only one nucleus per cell, is tapered at both ends, and is called involuntary muscle.
Cardiac muscle tissue is only found in the heart, and cardiac contractions pump blood throughout the body and maintain blood pressure. Like skeletal muscle, cardiac muscle is striated, but unlike skeletal muscle, cardiac muscle cannot be consciously controlled and is called involuntary muscle. It has one nucleus per cell, is branched, and is distinguished by the presence of intercalated disks.
Review Question:
Quick Review: Differences in muscle tissues
Skeletal Muscle Fiber Structure
Each skeletal muscle fiber is a skeletal muscle cell. These cells are incredibly large, with diameters of up to 100 µm and lengths of up to 30 cm. The plasma membrane of a skeletal muscle fiber is called the sarcolemma. The sarcolemma is the site of action potential conduction, which triggers muscle contraction. Within each muscle fiber are myofibrils—long cylindrical structures that lie parallel to the muscle fiber. Myofibrils run the entire length of the muscle fiber, and because they are only approximately 1.2 µm in diameter, hundreds to thousands can be found inside one muscle fiber. They attach to the sarcolemma at their ends, so that as myofibrils shorten, the entire muscle cell contracts.
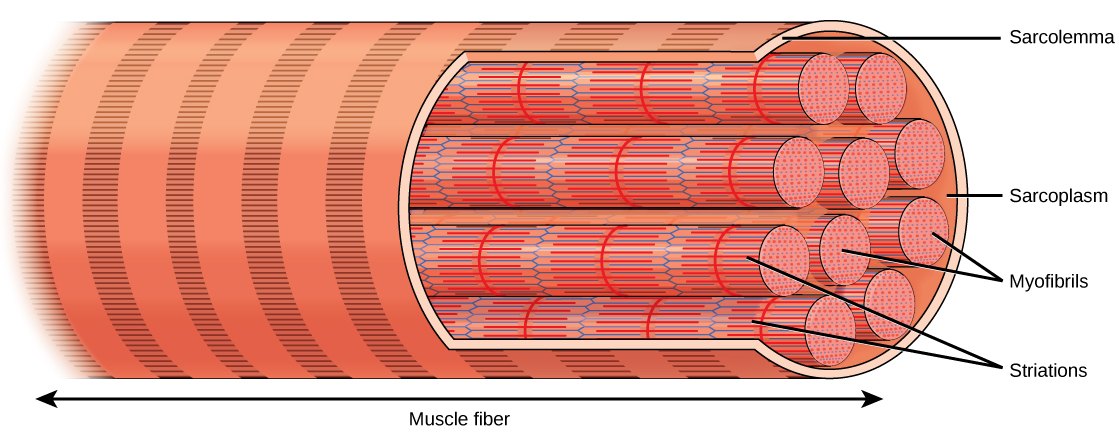
The striated appearance of skeletal muscle tissue is a result of repeating bands of the proteins actin and myosin that are present along the length of myofibrils. Dark A bands and light I bands repeat along myofibrils, and the alignment of myofibrils in the cell causes the entire cell to appear striated or banded.
Each I band has a dense line running vertically through the middle called a Z disc or Z line. The Z discs mark the border of units called sarcomeres, which are the functional units of skeletal muscle. One sarcomere is the space between two consecutive Z discs and contains one entire A band and two halves of an I band, one on either side of the A band. A myofibril is composed of many sarcomeres running along its length, and as the sarcomeres individually contract, the myofibrils and muscle cells shorten.
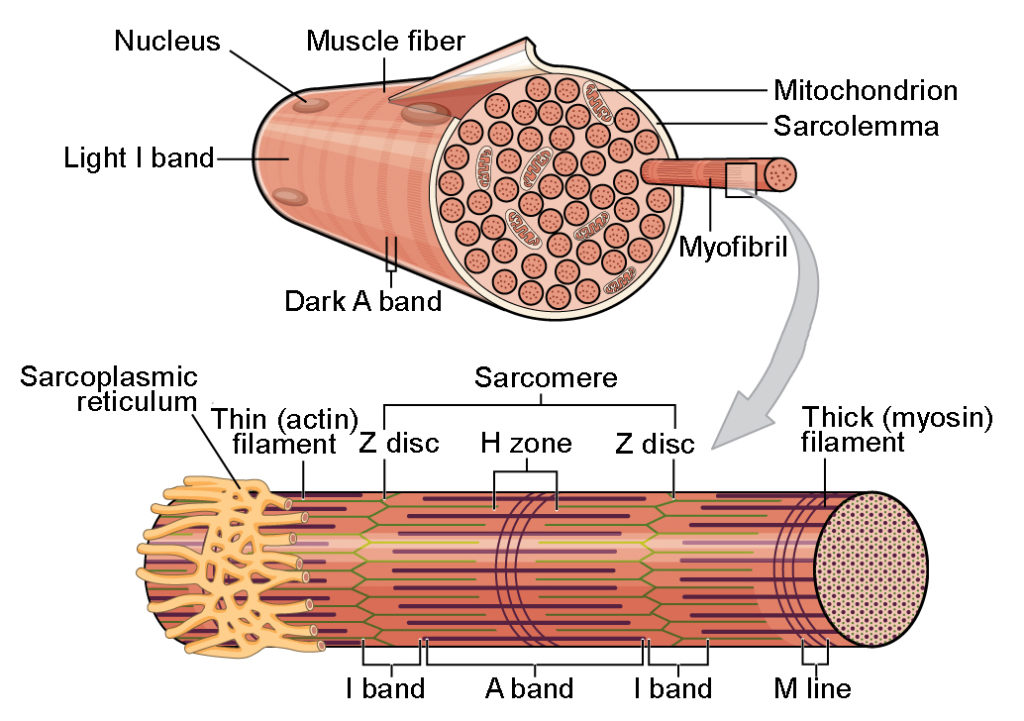
Myofibrils are composed of smaller structures called myofilaments. There are two main types of filaments: thick filaments and thin filaments; each has different compositions and locations. Thick filaments are composed of the protein myosin and occur only in the A band of a myofibril. Thin filaments are comprised primarily of actin, attach to a protein in the Z disc and occur across the entire length of the I band and partway into the A band. Actin has binding sites for myosin but strands of tropomyosin filaments block the sites and prevent actin-myosin interactions when the muscles are at rest. The final component of the thin filaments in troponin, which is a globular protein with three subunits. One subunit binds to the topomyosin, one to the actin and the last to Ca2+ ions.
This video reviews some of the key components of skeletal muscles: https://youtu.be/XoP1diaXVCI
Review Question:
Quick Review: Filaments
Thin filaments are comprised mainly of __________
Sliding Filament Model of Contraction
For a muscle cell to contract, the sarcomere must shorten. However, thick and thin filaments—the components of sarcomeres—do not shorten. Instead, they slide by one another, causing the sarcomere to shorten while the filaments remain the same length. The sliding filament theory of muscle contraction was developed to fit the differences observed in the named bands on the sarcomere at different degrees of muscle contraction and relaxation. The mechanism of contraction is the binding of myosin to actin, forming cross-bridges that generate filament movement.
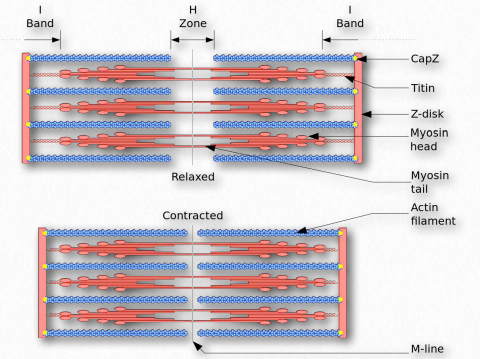
The sliding filament theory of muscle contraction can be broken down into four distinct stages;
1. Muscle activation: Each skeletal muscle fiber is controlled by a motor neuron, which conducts signals from the brain or spinal cord to the muscle. The area of the sarcolemma on the muscle fiber that interacts with the neuron is called the motor end plate. Electrical signals travel along the neuron’s axon, which branches through the muscle and connects to individual muscle fibers at a neuromuscular junction. In response to a neural signal, acetylcholine (a neurotransmitter) is released from the axon terminal and binds to receptors on the sarcolemma. An action potential is generated that stimulates calcium ion release from the sarcoplasmic reticulum.
2. Muscle contraction: Calcium floods into the muscle cell where it binds to troponin, causing conformational changes in troponin that allow tropomyosin to move away from the myosin-binding sites on actin. Once the tropomyosin is removed, a cross-bridge can form between actin and myosin. The myosin head at this point is “cocked,” it contains energy and is in a high-energy configuration. Pi is then released, allowing myosin to expend the stored energy as a conformational change. The myosin head moves toward the M line, pulling the actin along with it. As the actin is pulled, the filaments move toward the M line. This movement is called the power stroke, as it is the step at which force is produced. As the actin is pulled toward the M line, the sarcomere shortens, and the muscle contracts. After the movement, ADP is released; however, the cross-bridge formed is still in place, and actin and myosin are bound together.
3. Recharging: ATP can then attach to myosin, ATP binding causes myosin to release actin, allowing actin and myosin to detach from each other. After this happens, the newly bound ATP is converted to ADP and inorganic phosphate, Pi by an enzyme at the binding site on myosin called ATPase. The energy released during ATP hydrolysis changes the angle of the myosin head into a “cocked” position. The myosin head is then in a position for further movement, possessing potential energy, but ADP and Pi are still attached. This conformation change in myosin allows the cross-bridge cycle to start again and further muscle contraction can occur triggering contraction.
4. Relaxation: Relaxation occurs when stimulation of the nerve stops. Calcium is then pumped back into the sarcoplasmic reticulum breaking the link between actin and myosin. Actin and myosin return to their unbound state causing the muscle to relax. Alternatively, relaxation (failure) will also occur when ATP is no longer available.
This video demonstrates how all the parts of the system work together to create muscle movement. https://youtu.be/BVcgO4p88AA
Review Question:
Control of Muscle Tension
Neural control initiates the formation of actin-myosin cross-bridges, leading to the sarcomere shortening involved in muscle contraction. These contractions extend from the muscle fiber through connective tissue to pull on bones, causing skeletal movement. The pull exerted by a muscle is called tension, and the amount of force created by this tension can vary. This enables the same muscles to move very light objects and very heavy objects. In individual muscle fibers, the amount of tension produced depends on the cross-sectional area of the muscle fiber and the frequency of neural stimulation.
The number of cross-bridges formed between actin and myosin determines the amount of tension that a muscle fiber can produce. Cross-bridges can only form where thick and thin filaments overlap, allowing myosin to bind to actin. If more cross-bridges are formed, more myosin will pull on actin, and more tension will be produced.
The ideal length of a sarcomere during the production of maximal tension occurs when thick and thin filaments overlap to the greatest degree. If a sarcomere at rest is stretched past an ideal resting length, thick and thin filaments do not overlap to the greatest degree, and fewer cross-bridges can form. This results in fewer myosin heads pulling on actin, and less tension is produced. As a sarcomere is shortened, the zone of overlap is reduced as the thin filaments reach the H zone, which is composed of myosin tails. Because it is myosin heads that form cross-bridges, actin will not bind to myosin in this zone, reducing the tension produced by this myofiber. If the sarcomere is shortened, even more, thin filaments begin to overlap with each other—reducing cross-bridge formation even further and producing even less tension. Conversely, if the sarcomere is stretched to the point at which thick and thin filaments do not overlap at all, no cross-bridges are formed and no tension is produced. This amount of stretching does not usually occur because accessory proteins, internal sensory nerves, and connective tissue oppose extreme stretching.
The primary variable determining force production is the number of myofibers within the muscle that receive an action potential from the neuron that controls that fiber. When using the biceps to pick up a pencil, the motor cortex of the brain only signals a few neurons of the biceps, and only a few myofibers respond. In vertebrates, each myofiber responds fully if stimulated. When picking up a piano, the motor cortex signals all of the neurons in the biceps, and every myofiber participates. This is close to the maximum force the muscle can produce. As mentioned above, increasing the frequency of action potentials (the number of signals per second) can increase the force a bit more, because the tropomyosin is flooded with calcium.
Summary
The body contains three types of muscle tissue: skeletal muscle, cardiac muscle, and smooth muscle. Skeleton muscle tissue is composed of sarcomeres, the functional units of muscle tissue. Muscle contraction occurs when sarcomeres shorten, as thick and thin filaments slide past each other, which is called the sliding filament model of muscle contraction. ATP provides the energy for cross-bridge formation and filament sliding. Regulatory proteins, such as troponin and tropomyosin, control cross-bridge formation. The number of muscle fibers contracting determines how much force the whole muscle produces.
End of Section Review Questions:
Review: Blocking binding
Review: Muscle Structure
3) The cell membrane of a muscle fiber is called a?
Review: Driving muscle contraction
References:
Learning Goals
By the end of this reading you should be able to:
- Describe the different types of muscle tissue
- Draw the basic structure of a skeletal muscle fiber
- Explain the sliding filament model of muscle contraction
- Describe the factors that control muscle tension
Introduction
Muscle cells are specialized for contraction. Muscles allow for motions such as walking, and they also facilitate bodily processes such as respiration and digestion. The body contains three types of muscle tissue: skeletal muscle, cardiac muscle, and smooth muscle.
Skeletal muscle tissue forms skeletal muscles, which attach to bones or skin and control locomotion and any movement that can be consciously controlled. Because it can be controlled by thought, skeletal muscle is also called voluntary muscle. Skeletal muscles are long and cylindrical in appearance; when viewed under a microscope, skeletal muscle tissue has a striped or striated appearance. The striations are caused by the regular arrangement of contractile proteins (actin and myosin). Actin is a globular contractile protein that interacts with myosin for muscle contraction. Skeletal muscle also has multiple nuclei present in a single cell.
Smooth muscle tissue occurs in the walls of hollow organs such as the intestines, stomach, and urinary bladder, and around passages such as the respiratory tract and blood vessels. Smooth muscle has no striations, is not under voluntary control, has only one nucleus per cell, is tapered at both ends, and is called involuntary muscle.
Cardiac muscle tissue is only found in the heart, and cardiac contractions pump blood throughout the body and maintain blood pressure. Like skeletal muscle, cardiac muscle is striated, but unlike skeletal muscle, cardiac muscle cannot be consciously controlled and is called involuntary muscle. It has one nucleus per cell, is branched, and is distinguished by the presence of intercalated disks.
Review Question:
Quick Review: Differences in muscle tissues
Skeletal Muscle Fiber Structure
Each skeletal muscle fiber is a skeletal muscle cell. These cells are incredibly large, with diameters of up to 100 µm and lengths of up to 30 cm. The plasma membrane of a skeletal muscle fiber is called the sarcolemma. The sarcolemma is the site of action potential conduction, which triggers muscle contraction. Within each muscle fiber are myofibrils—long cylindrical structures that lie parallel to the muscle fiber. Myofibrils run the entire length of the muscle fiber, and because they are only approximately 1.2 µm in diameter, hundreds to thousands can be found inside one muscle fiber. They attach to the sarcolemma at their ends, so that as myofibrils shorten, the entire muscle cell contracts.
The striated appearance of skeletal muscle tissue is a result of repeating bands of the proteins actin and myosin that are present along the length of myofibrils. Dark A bands and light I bands repeat along myofibrils, and the alignment of myofibrils in the cell causes the entire cell to appear striated or banded.
Each I band has a dense line running vertically through the middle called a Z disc or Z line. The Z discs mark the border of units called sarcomeres, which are the functional units of skeletal muscle. One sarcomere is the space between two consecutive Z discs and contains one entire A band and two halves of an I band, one on either side of the A band. A myofibril is composed of many sarcomeres running along its length, and as the sarcomeres individually contract, the myofibrils and muscle cells shorten.
Myofibrils are composed of smaller structures called myofilaments. There are two main types of filaments: thick filaments and thin filaments; each has different compositions and locations. Thick filaments are composed of the protein myosin and occur only in the A band of a myofibril. Thin filaments are comprised primarily of actin, attach to a protein in the Z disc and occur across the entire length of the I band and partway into the A band. Actin has binding sites for myosin but strands of tropomyosin filaments block the sites and prevent actin-myosin interactions when the muscles are at rest. The final component of the thin filaments in troponin, which is a globular protein with three subunits. One subunit binds to the topomyosin, one to the actin and the last to Ca2+ ions.
This video reviews some of the key components of skeletal muscles: https://youtu.be/XoP1diaXVCI
Review Question:
Quick Review: Filaments
Thin filaments are comprised mainly of __________
Sliding Filament Model of Contraction
For a muscle cell to contract, the sarcomere must shorten. However, thick and thin filaments—the components of sarcomeres—do not shorten. Instead, they slide by one another, causing the sarcomere to shorten while the filaments remain the same length. The sliding filament theory of muscle contraction was developed to fit the differences observed in the named bands on the sarcomere at different degrees of muscle contraction and relaxation. The mechanism of contraction is the binding of myosin to actin, forming cross-bridges that generate filament movement.
The sliding filament theory of muscle contraction can be broken down into four distinct stages;
1. Muscle activation: Each skeletal muscle fiber is controlled by a motor neuron, which conducts signals from the brain or spinal cord to the muscle. The area of the sarcolemma on the muscle fiber that interacts with the neuron is called the motor end plate. Electrical signals travel along the neuron’s axon, which branches through the muscle and connects to individual muscle fibers at a neuromuscular junction. In response to a neural signal, acetylcholine (a neurotransmitter) is released from the axon terminal and binds to receptors on the sarcolemma. An action potential is generated that stimulates calcium ion release from the sarcoplasmic reticulum.
2. Muscle contraction: Calcium floods into the muscle cell where it binds to troponin, causing conformational changes in troponin that allow tropomyosin to move away from the myosin-binding sites on actin. Once the tropomyosin is removed, a cross-bridge can form between actin and myosin. The myosin head at this point is “cocked,” it contains energy and is in a high-energy configuration. Pi is then released, allowing myosin to expend the stored energy as a conformational change. The myosin head moves toward the M line, pulling the actin along with it. As the actin is pulled, the filaments move toward the M line. This movement is called the power stroke, as it is the step at which force is produced. As the actin is pulled toward the M line, the sarcomere shortens, and the muscle contracts. After the movement, ADP is released; however, the cross-bridge formed is still in place, and actin and myosin are bound together.
3. Recharging: ATP can then attach to myosin, ATP binding causes myosin to release actin, allowing actin and myosin to detach from each other. After this happens, the newly bound ATP is converted to ADP and inorganic phosphate, Pi by an enzyme at the binding site on myosin called ATPase. The energy released during ATP hydrolysis changes the angle of the myosin head into a “cocked” position. The myosin head is then in a position for further movement, possessing potential energy, but ADP and Pi are still attached. This conformation change in myosin allows the cross-bridge cycle to start again and further muscle contraction can occur triggering contraction.
4. Relaxation: Relaxation occurs when stimulation of the nerve stops. Calcium is then pumped back into the sarcoplasmic reticulum breaking the link between actin and myosin. Actin and myosin return to their unbound state causing the muscle to relax. Alternatively, relaxation (failure) will also occur when ATP is no longer available.
This video demonstrates how all the parts of the system work together to create muscle movement. https://youtu.be/BVcgO4p88AA
Review Question:
Control of Muscle Tension
Neural control initiates the formation of actin-myosin cross-bridges, leading to the sarcomere shortening involved in muscle contraction. These contractions extend from the muscle fiber through connective tissue to pull on bones, causing skeletal movement. The pull exerted by a muscle is called tension, and the amount of force created by this tension can vary. This enables the same muscles to move very light objects and very heavy objects. In individual muscle fibers, the amount of tension produced depends on the cross-sectional area of the muscle fiber and the frequency of neural stimulation.
The number of cross-bridges formed between actin and myosin determines the amount of tension that a muscle fiber can produce. Cross-bridges can only form where thick and thin filaments overlap, allowing myosin to bind to actin. If more cross-bridges are formed, more myosin will pull on actin, and more tension will be produced.
The ideal length of a sarcomere during the production of maximal tension occurs when thick and thin filaments overlap to the greatest degree. If a sarcomere at rest is stretched past an ideal resting length, thick and thin filaments do not overlap to the greatest degree, and fewer cross-bridges can form. This results in fewer myosin heads pulling on actin, and less tension is produced. As a sarcomere is shortened, the zone of overlap is reduced as the thin filaments reach the H zone, which is composed of myosin tails. Because it is myosin heads that form cross-bridges, actin will not bind to myosin in this zone, reducing the tension produced by this myofiber. If the sarcomere is shortened, even more, thin filaments begin to overlap with each other—reducing cross-bridge formation even further and producing even less tension. Conversely, if the sarcomere is stretched to the point at which thick and thin filaments do not overlap at all, no cross-bridges are formed and no tension is produced. This amount of stretching does not usually occur because accessory proteins, internal sensory nerves, and connective tissue oppose extreme stretching.
The primary variable determining force production is the number of myofibers within the muscle that receive an action potential from the neuron that controls that fiber. When using the biceps to pick up a pencil, the motor cortex of the brain only signals a few neurons of the biceps, and only a few myofibers respond. In vertebrates, each myofiber responds fully if stimulated. When picking up a piano, the motor cortex signals all of the neurons in the biceps, and every myofiber participates. This is close to the maximum force the muscle can produce. As mentioned above, increasing the frequency of action potentials (the number of signals per second) can increase the force a bit more, because the tropomyosin is flooded with calcium.
Summary
The body contains three types of muscle tissue: skeletal muscle, cardiac muscle, and smooth muscle. Skeleton muscle tissue is composed of sarcomeres, the functional units of muscle tissue. Muscle contraction occurs when sarcomeres shorten, as thick and thin filaments slide past each other, which is called the sliding filament model of muscle contraction. ATP provides the energy for cross-bridge formation and filament sliding. Regulatory proteins, such as troponin and tropomyosin, control cross-bridge formation. The number of muscle fibers contracting determines how much force the whole muscle produces.
End of Section Review Questions:
Review: Blocking binding
Review: Muscle Structure
3) The cell membrane of a muscle fiber is called a?
Review: Driving muscle contraction
References:
Learning Goals:
By the end of this reading, you should be able to:
- List the synapomorphic traits of the Superphylas Lophotrochozoa and Ecdysozoa
- Describe the key features of Platyhelminthes
- Discuss the shared characteristics of mollusks and the unique features of Bivalvia, Gastropoda, and Cephalopoda classes
- Describe the features of animals classified in phylum Annelida and discuss the advantages of body segmentation
- Compare the features of Nematodes and Annelids
- Describe the internal systems and appendage specializations of phylum Arthropoda
- Discuss the reasons for arthropod success and abundance
Introduction
Protostomes are animals whose blastopore (initiated by gastrulation) becomes the mouth of the future digestive system. This is called protostomy or “first mouth.” In protostomy, solid groups of cells split from the endoderm or inner germ layer to form a central mesodermal layer of cells. This layer multiplies into a band and then splits internally to form the coelom; this protostomic coelom is hence termed schizocoelom. Based on molecular evidence, protostomes are divided into two major groups. Lophotrochozoans are characterized by either the presence at some point in the organism's development of a lophophore (ciliated, horse-shoe feeding shaped structure) or a trochophore larval stage (free-swimming planktonic marine larva with several bands of cilia). Ecdysozoans are characterized by ecdysis, a feature in which the organism molts its exoskeleton as it grows.
Superphylum Lophotrochozoa
As lophotrochozoans, the organisms in this superphylum possess either a lophophore or trochophore larvae. The lophophores are a set of ciliated tentacles surrounding the mouth. Trochophore larvae are characterized by two bands of cilia around the body.
The lophotrochozoans are triploblastic and thus possess an embryonic mesoderm sandwiched between the ectoderm and endoderm which is not found in the diploblastic cnidarians. These phyla are also bilaterally symmetrical, meaning that a longitudinal section will divide them into right and left sides that are symmetrical. It also indicates the beginning of cephalization, the evolution of a concentration of nervous tissues and sensory organs in the head of the organism, which is where it first encounters its environment.
Phyla of this superphylum include Platyhelminthes (platy = flat, helminth = worm; flatworms), Rotifera (rotifers), Nemertea (ribbon worms), Mollusca (mollusks), and Annelida (segmented worms). Ecdysozoans include the phyla Nematoda (roundworms) and Arthropoda, the largest animal phylum in the world that include the subphyla Hexapoda (insects), Myriapoda (centipedes and millipedes), Crustacea (crustaceans), and Chelicerata (spiders, ticks, scorpions, etc.). For the sake of this course, we will only focus on the groups and material for which you are responsible.
Phylum Platyhelminthes
The flatworms are acoelomate organisms that include many free-living and parasitic forms. Flatworms have three embryonic tissue layers that give rise to surfaces that cover tissues (from ectoderm), internal tissues (from mesoderm), and line the digestive system (from endoderm). Their bodies are solid between the outer surface and the cavity of the digestive system. The free-living species of flatworms are predators or scavengers. Parasitic forms feed on the tissues of their hosts.

Most flatworms have a gastrovascular cavity rather than a complete digestive system. In such animals, the “mouth” is also used to expel waste materials from the digestive system. Digestion is extracellular, with digested materials taken into the cells of the gut lining by phagocytosis. The nervous system consists of a pair of nerve cords running the length of the body with connections between them and a large ganglion or concentration of nerves at the anterior end of the worm, where there may also be a concentration of photosensory and chemosensory cells.
There is neither a circulatory nor respiratory system, with gas and nutrient exchange dependent on diffusion and cell-cell junctions. This necessarily limits the thickness of the body in these organisms, constraining them to be “flat” worms. Most flatworm species are monoecious, and fertilization is typically internal. Asexual reproduction is common in some groups.
Review Question:
Quick Review: Platyhelminthes
Phylum Mollusca
Mollusca is the predominant phylum in marine environments. It is estimated that 23 percent of all known marine species are mollusks; there are over 75,000 described species, making them the second most diverse phylum of animals. The name “Mollusca” signifies a soft body since the earliest descriptions of mollusks came from observations of unshelled cuttlefish. Mollusks are predominantly a marine group of animals; however, they are known to inhabit freshwater as well as terrestrial habitats. Mollusks display a wide range of morphologies in each class and subclass, but share a few key characteristics, including a muscular foot, a visceral mass containing internal organs, and a mantle that may or may not secrete a shell of calcium carbonate.

The muscular foot is used for locomotion and anchorage, and varies in shape and function, depending on the type of mollusk. In shelled mollusks, this foot is usually the same size as the opening of the shell. The foot is a retractable as well as an extendable organ. The foot is the ventral-most organ, whereas the mantle is the limiting dorsal organ.
The visceral mass is present above the foot, in the visceral hump. This includes the digestive, nervous, excretory, reproductive, and respiratory systems. Mollusk species that are exclusively aquatic have gills for respiration, whereas some terrestrial species have lungs for respiration. Additionally, a tongue-like organ called a radula, which bears chitinous tooth-like ornamentation, is present in many species and serves to shred or scrape food. The mantle is the dorsal epidermis in mollusks; shelled mollusks are specialized to secrete a chitinous and hard calcareous shell. Mollusks are eucoelomate, but the coelomic cavity is restricted to a cavity around the heart in adult animals. The mantle cavity develops independently of the coelomic cavity.
Classification of Phylum Mollusca
Phylum Mollusca is a very diverse (85,000 species) group with a dramatic variety of forms, ranging from large predatory squids and octopuses, some of which show a high degree of intelligence, to grazing forms with elaborately sculpted and colored shells. While this phylum can be segregated into seven classes: Aplacophora, Monoplacophora, Polyplacophora, Bivalvia, Gastropoda, Cephalopoda, and Scaphopoda. this section will only focus on the classes Bivalvia, Gastropoda, and Cephalopoda.
Class Bivalvia
Bivalves (“two shells”) include clams, oysters, mussels, scallops, and geoducks that found in marine as well as freshwater habitats. As the name suggests, bivalves are enclosed in a pair of shells (valves are commonly called “shells”) that are hinged at the dorsal end by shell ligaments as well as shell teeth. The overall morphology is laterally flattened, and the head region is poorly developed. Eyespots and statocysts may be absent in some species. Since these animals are suspension feeders, a radula is absent in this class of mollusks. Respiration is facilitated by a pair of ctenidia, whereas excretion and osmoregulation are brought about by a pair of nephridia. Bivalves often possess a large mantle cavity. In some species, the posterior edges of the mantle may fuse to form two siphons that serve to take in and exude water.

One of the functions of the mantle is to secrete the shell. Some bivalves like oysters and mussels possess the unique ability to secrete and deposit a calcareous nacre or “mother of pearl” around foreign particles that may enter the mantle cavity. This property has been commercially exploited to produce pearls.
Class Gastropoda

Animals in class Gastropoda (“stomach foot”) include well-known mollusks like snails, slugs, conchs, sea hares, and sea butterflies. Gastropoda includes shell-bearing species as well as species with a reduced shell. These animals are asymmetrical and usually present a coiled shell. Shells may be planospiral (like a garden hose wound up), commonly seen in garden snails, or conispiral, (like a spiral staircase), commonly seen in marine conches.

The visceral mass in the shelled species displays torsion around the perpendicular axis on the center of the foot, which is the key characteristic of this group, along with a foot that is modified for crawling. Most gastropods bear a head with tentacles, eyes, and a style. A complex radula is used by the digestive system and aids in the ingestion of food. Eyes may be absent in some gastropods species. The mantle cavity encloses the ctenidia as well as a pair of nephridia.
Class Cephalopoda
Class Cephalopoda (“head foot” animals) include octopi, squids, cuttlefish, and nautilus. Cephalopods are a class of shell-bearing animals as well as mollusks with a reduced shell. They display vivid coloration, typically seen in squids and octopi, which is used for camouflage. All animals in this class are carnivorous predators and have beak-like jaws at the anterior end. All cephalopods show the presence of a very well-developed nervous system along with eyes, as well as a closed circulatory system. The foot is lobed and developed into tentacles, and a funnel, which is used as their mode of locomotion. Suckers are present on the tentacles in octopi and squid. Ctenidia are enclosed in a large mantle cavity and are serviced by large blood vessels, each with its own heart associated with it; the mantle has siphonophores that facilitate the exchange of water.
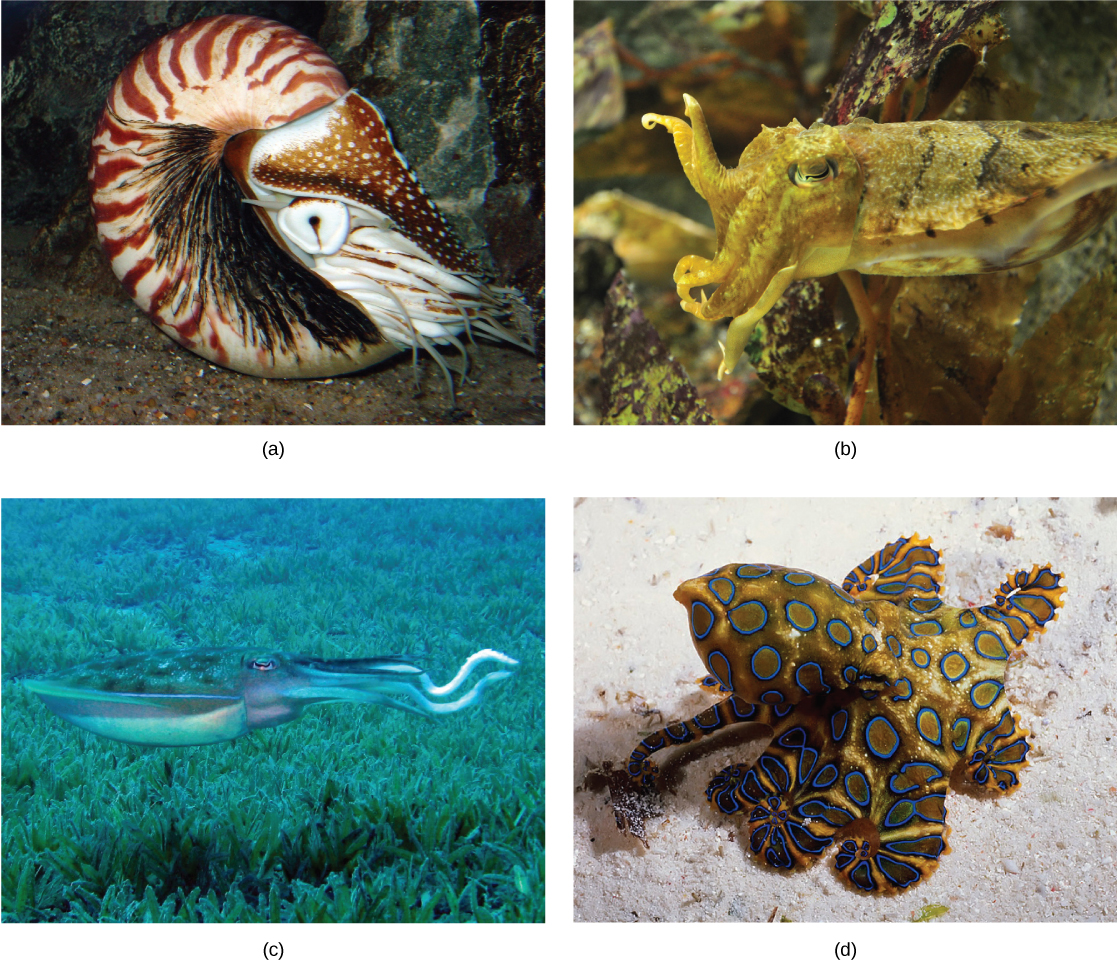
Locomotion in cephalopods is facilitated by ejecting a stream of water for propulsion. This is called “jet” propulsion. A pair of nephridia is present within the mantle cavity. Sexual dimorphism is seen in this class of animals. Members of a species mate, and the female then lays the eggs in a secluded and protected niche. Females of some species care for the eggs for an extended period of time and may end up dying during that time period. Cephalopods such as squids and octopi also produce sepia or a dark ink, which is squirted upon a predator to assist in a quick getaway.
Reproduction in cephalopods is different from other mollusks in that the egg hatches to produce a juvenile adult without undergoing the trochophore and veliger larval stages.
In the shell-bearing Nautilus spp., the spiral shell is multi-chambered. These chambers are filled with gas or water to regulate buoyancy. The shell structure in squids and cuttlefish is reduced and is present internally in the form of a squid pen and cuttlefish bone, respectively.
Review Question:
Phylum Annelida
Annelids include segmented worms which comprise the class Polychaeta (the polychaetes) and the class Oligochaeta (the earthworms, leeches, and their relatives). These animals are found in marine, terrestrial, and freshwater habitats, but the presence of water or humidity is a critical factor for their survival, especially in terrestrial habitats. The name of the phylum is derived from the Latin word annellus, which means a small ring. Approximately 16,500 species have been described in phylum Annelida, some of which show parasitic and commensal symbioses with other species in their habitat. The phylum includes earthworms, polychaete worms, and leeches. Annelids show protostomic development in embryonic stages and are often called “segmented worms” due to their key characteristic of metamerism, or true segmentation.
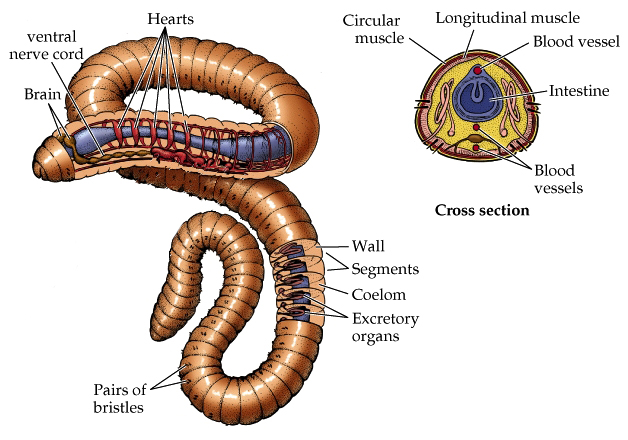
Annelids display bilateral symmetry and are worm-like in overall morphology. Annelids have a segmented body plan wherein the internal and external morphological features are repeated in each body segment. Metamerism allows animals to become bigger by adding “compartments” while making their movement more efficient. The epidermis is protected by an acellular, external cuticle, but this is much thinner than the cuticle found in the ecdysozoans and does not require periodic shedding for growth. Annelids show the presence of a true coelom, derived from embryonic mesoderm and protostomy. Hence, they are the most advanced worms. A well-developed and complete digestive system is present in earthworms (oligochaetes) with a mouth, muscular pharynx, esophagus, crop, and gizzard being present. The gizzard leads to the intestine and ends in an anal opening. Each segment is limited by a membranous septum that divides the coelomic cavity into a series of compartments.

Annelids possess a closed circulatory system (fluid of the circulatory system always remains in vessels and never bathes the tissues directly, as in an open circulatory system) of dorsal and ventral blood vessels that run parallel to the alimentary canal as well as capillaries that service individual tissues. In addition, these vessels are connected by transverse loops in every segment. These animals lack a well-developed respiratory system, and gas exchange occurs across the moist body surface. Excretion is facilitated by a pair of metanephridia (a type of primitive “kidney” that consists of a convoluted tubule and an open, ciliated funnel) that is present in every segment towards the ventral side. Annelids show well-developed nervous systems with a nerve ring of fused ganglia present around the pharynx. The nerve cord is ventral in position and bears enlarged nodes or ganglia in each segment.
Review Question:
Quick Review: annelids
Superphylum Ecdysozoa
The superphylum Ecdysozoa contains an incredibly large number of species. This is because it contains two of the most diverse animal groups: phylum Nematoda (the roundworms) and Phylum Arthropoda (the arthropods). The most prominent distinguishing feature of Ecdysozoans is their tough external covering called the cuticle. The cuticle provides a tough, but flexible exoskeleton that protects these animals from water loss, predators, and other aspects of the external environment. All members of this superphylum periodically molt, or shed their cuticle as they grow. After molting, they secrete a new cuticle that will last until their next growth phase. The process of molting and replacing the cuticle is called ecdysis, which is how the superphylum derived its name.
Phylum Nematoda
The Nematoda, like most other animal phyla, are triploblastic and possess an embryonic mesoderm and are bilaterally symmetrical. Furthermore, the nematodes, or roundworms, possess a pseudocoelom and consist of both free-living and parasitic forms. This phylum includes more than 28,000 species with an estimated 16,000 being parasitic in nature. The name Nematoda is derived from the Greek word “Nemos,” which means “thread” and includes roundworms. Nematodes are present in all habitats with a large number of individuals of each species present in each.
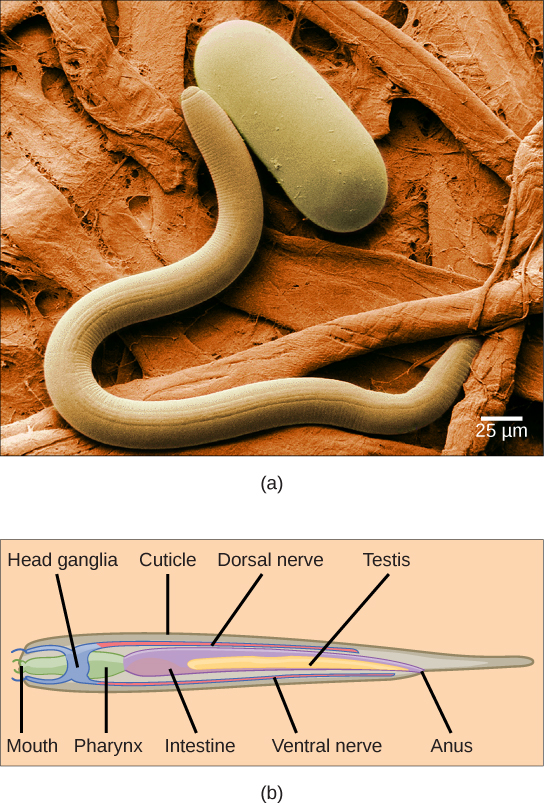
Nematodes show a tubular morphology and circular cross-section. These animals are pseudocoelomates and show the presence of a complete digestive system with a distinct mouth and anus. The head is radially symmetrical. A mouth opening is present at the anterior end with three or six lips as well as teeth in some species in the form of cuticle extensions. Some nematodes may present other external modifications like rings, head shields, or warts. Rings, however, do not reflect true internal body segmentation. The mouth leads to a muscular pharynx and intestine, which leads to a rectum and anal opening at the posterior end. The muscles of nematodes differ from those of most animals: They have a longitudinal layer only, which accounts for the whip-like motion of their movement. Most nematodes possess four longitudinal nerve cords that run along the length of the body in dorsal, ventral, and lateral positions. The ventral nerve cord is better developed than the dorsal or lateral cords. All nerve cords fuse at the anterior end, around the pharynx, to form head ganglia or the “brain” of the worm (which take the form of a ring around the pharynx) as well as at the posterior end to form the tail ganglia. In C. elegans, the nervous system accounts for nearly one-third of the total number of cells in the animal.
Phylum Arthropoda
The name “Arthropoda” means “jointed legs” (in Greek, “arthros” means “joint” and “podos” means “leg”); it aptly describes the enormous number of invertebrates included in this phylum. Arthropoda dominates the animal kingdom with an estimated 85 percent of known species included in this phylum and many arthropods yet undocumented. The principal characteristics of all the animals in this phylum are functional segmentation of the body and the presence of jointed appendages. Arthropods also show the presence of an exoskeleton made principally of chitin, which is a waterproof, tough polysaccharide. Phylum Arthropoda is the largest phylum in the animal world, and insects form the single largest class within this phylum. Arthropods are eucoelomate, protostomic organisms.
Phylum Arthropoda includes animals that have been successful in colonizing terrestrial, aquatic, and aerial habitats. This phylum is further classified into five subphyla: Trilobitomorpha (trilobites, all extinct), Hexapoda (insects and relatives), Myriapoda (millipedes, centipedes, and relatives), Crustaceans (crabs, lobsters, crayfish, isopods, barnacles, and some zooplankton), and Chelicerata (horseshoe crabs, arachnids, scorpions, and daddy longlegs).

A unique feature of animals in the arthropod phylum is the presence of a segmented body and the fusion of sets of segments that give rise to functional body regions called tagma. Tagma may be in the form of a head, thorax, and abdomen, or a cephalothorax and abdomen, or a head and trunk. A central cavity, called the hemocoel (or blood cavity), is present, and the open circulatory system is regulated by a tubular or single-chambered heart. Respiratory systems vary depending on the group of arthropod: insects and myriapods use a series of tubes (tracheae) that branch through the body, open to the outside through openings called spiracles, and perform gas exchange directly between the cells and air in the tracheae, whereas aquatic crustaceans utilize gills, terrestrial chelicerates employ book lungs, and aquatic chelicerates use book gills.
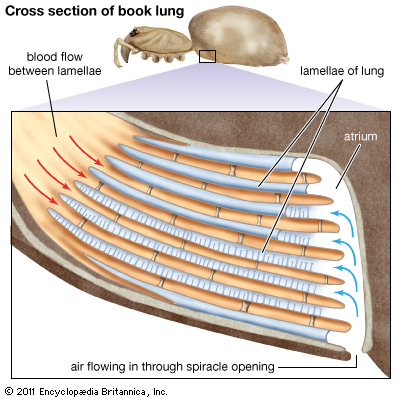
The book lungs of arachnids (scorpions, spiders, ticks, and mites) contain a vertical stack of hemocoel wall tissue that somewhat resembles the pages of a book. Between each of the "pages" of tissue is an air space. This allows both sides of the tissue to be in contact with the air at all times, greatly increasing the efficiency of gas exchange. The gills of crustaceans are filamentous structures that exchange gases with the surrounding water. Groups of arthropods also differ in the organs used for excretion, with crustaceans possessing green glands and insects using Malpighian tubules, which work in conjunction with the hindgut to reabsorb water while ridding the body of nitrogenous waste.
The cuticle is the covering of an arthropod. It is made up of two layers: the epicuticle, which is a thin, waxy water-resistant outer layer containing no chitin, and the layer beneath it, the chitinous procuticle. Chitin is a tough, flexible polysaccharide. In order to grow, the arthropod must shed the exoskeleton during a process called ecdysis (“to strip off”); this is a cumbersome method of growth, and during this time, the animal is vulnerable to predation. The characteristic morphology of representative animals from each subphylum is described below.
Subphylum Hexapoda
The name Hexapoda denotes the presence of six legs (three pairs) in these animals as differentiated from the number of pairs present in other arthropods. Hexapods are characterized by the presence of a head, thorax, and abdomen, constituting three tagma. The thorax bears the wings as well as six legs in three pairs. Many of the common insects we encounter on a daily basis—including ants, cockroaches, butterflies, and flies—are examples of Hexapoda.

Amongst the hexapods, the insects are the largest class in terms of species diversity as well as biomass in terrestrial habitats. Typically, the head bears one pair of sensory antennae, mandibles as mouthparts, a pair of compound eyes, and some ocelli (simple eyes) along with numerous sensory hairs. The thorax bears three pairs of legs (one pair per segment) and two pairs of wings, with one pair each on the second and third thoracic segments. The abdomen usually has eleven segments and bears reproductive apertures. Hexapoda includes insects that are winged (like fruit flies) and wingless (like fleas).
Subphylum Myriapoda
Subphylum Myriapoda includes arthropods with numerous legs. Although the name is hyperbolic in suggesting that myriad legs are present in these invertebrates, the number of legs may vary from 10 to 750. This subphylum includes 13,000 species; the most commonly found examples are millipedes and centipedes. All myriapods are terrestrial animals and prefer a humid environment.

Myriapods are typically found in moist soils, decaying biological material, and leaf litter. Subphylum Myriapoda is divided into four classes: Chilopoda, Symphyla, Diplopoda, and Pauropoda. Centipedes like Scutigera coleoptrata) are classified as chilopods. These animals bear one pair of legs per segment, mandibles as mouthparts, and are somewhat dorsoventrally flattened. The legs in the first segment are modified to form forcipules (poison claws) that deliver poison to prey like spiders and cockroaches, as these animals are all predatory. Millipedes bear two pairs of legs per diplosegment, a feature that results from the embryonic fusion of adjacent pairs of body segments, are usually rounder in cross-section, and are herbivores or detritivores. Millipedes have visibly more numbers of legs as compared to centipedes, although they do not bear a thousand legs
Subphylum Crustacea

Crustaceans are the most dominant aquatic arthropods since the total number of marine crustacean species stands at 67,000, but there are also freshwater and terrestrial crustacean species. Krill, shrimp, lobsters, crabs, and crayfish are examples of crustaceans. Terrestrial species like the woodlice (Armadillidium spp.) (also called pill bugs, rolly pollies, potato bugs, or isopods) are also crustaceans, although the number of non-aquatic species in this subphylum is relatively low.

Crustaceans possess two pairs of antennae, mandibles as mouthparts, and biramous (“two-branched”) appendages, which means that their legs are formed in two parts, as distinct from the uniramous (“one branched”) myriapods and hexapods.
Unlike that of the Hexapoda, the head and thorax of most crustaceans are fused to form a cephalothorax, which is covered by a plate called the carapace, thus producing a body structure of two tagmata. Crustaceans have a chitinous exoskeleton that is shed by molting whenever the animal increases in size. The exoskeletons of many species are also infused with calcium carbonate, which makes them even stronger than in other arthropods. Crustaceans have an open circulatory system where blood is pumped into the hemocoel by the dorsally located heart. Hemocyanin and hemoglobin are the respiratory pigments present in these animals.

Most crustaceans are dioecious, which means that the sexes are separate. Some species like barnacles may be hermaphrodites. Serial hermaphroditism, where the gonad can switch from producing sperm to ova, may also be seen in some species. Fertilized eggs may be held within the female of the species or may be released in the water. Terrestrial crustaceans seek out damp spaces in their habitats to lay eggs.

Larval stages—nauplius and zoea—are seen in the early development of crustaceans. A cypris larva is also seen in the early development of barnacles. Crustaceans possess a tripartite brain and two compound eyes. Most crustaceans are carnivorous, but herbivorous and detritivorous species are also known. Crustaceans may also be cannibalistic when extremely high populations of these organisms are present.
This subphylum includes animals such as spiders, scorpions, horseshoe crabs, and sea spiders. This subphylum is predominantly terrestrial, although some marine species also exist. An estimated 77,000 species are included in the subphylum Chelicerata. Chelicerates are found in almost all habitats.
The body of chelicerates may be divided into two parts: prosoma and opisthosoma, which are basically the equivalents of the cephalothorax (usually smaller) and abdomen (usually larger). A “head” tagmum is not usually discernible. The phylum derives its name from the first pair of appendages: the chelicerae, which are specialized, claw-like or fang-like mouthparts. These animals do not possess antennae. The second pair of appendages is known as pedipalps. In some species, like sea spiders, an additional pair of appendages, called ovigers, is present between the chelicerae and pedipalps.

Chelicerae are mostly used for feeding, but in spiders, these are often modified into fangs that inject venom into their prey before feeding. Members of this subphylum have an open circulatory system with a heart that pumps blood into the hemocoel. Aquatic species have gills, whereas terrestrial species have either trachea or book lungs for gaseous exchange.

Most chelicerates ingest food using a preoral cavity formed by the chelicerae and pedipalps. Some chelicerates may secrete digestive enzymes to pre-digest food before ingesting it. Parasitic chelicerates like ticks and mites have evolved blood-sucking apparatuses.
The nervous system in chelicerates consists of a brain and two ventral nerve cords. These animals use external fertilization as well as internal fertilization strategies for reproduction, depending upon the species and its habitat. Parental care for the young ranges from absolutely none to relatively prolonged care.
Visit https://evolution.berkeley.edu/evolibrary/article/arthropodstory to click through a lesson on arthropods, including interactive habitat maps, and more.
Summary
Phylum Annelida includes vermiform, segmented animals. Segmentation is seen in internal anatomy as well, which is called metamerism. Annelids are protostomes. These animals have well-developed neuronal and digestive systems. Some species bear a specialized band of segments known as a clitellum.
Flatworms are acoelomate, triploblastic animals. They lack circulatory and respiratory systems and have a rudimentary excretory system. This digestive system is incomplete in most species. Cestodes, or tapeworms, infect the digestive systems of primary vertebrate hosts.
Phylum Mollusca is a large, marine group of invertebrates. Mollusks show a variety of morphological variations within the phylum. This phylum is also distinct in that some members exhibit a calcareous shell as an external means of protection. Some mollusks have evolved a reduced shell. Mollusks are protostomes. The dorsal epidermis in mollusks is modified to form the mantle, which encloses the mantle cavity and visceral organs. This cavity is quite distinct from the coelomic cavity, which in the adult animal surrounds the heart. Respiration is facilitated by gills known as ctenidia. A chitinous-toothed tongue called the radula is present in most mollusks. Early development in some species occurs via two larval stages: trochophore and veliger.
Nematodes are pseudocoelomate animals akin to flatworms, yet display more advanced neuronal development, a complete digestive system, and a body cavity. A peculiar feature of nematodes is the secretion of a collagenous/chitinous cuticle outside the body.
Arthropods represent the most successful phylum of animals on Earth, in terms of the number of species as well as the number of individuals. These animals are characterized by a segmented body as well as the presence of jointed appendages. In the basic body plan, a pair of appendages is present per body segment. Within the phylum, traditional classification is based on mouthparts, a number of appendages, and modifications of appendages present. Arthropods bear a chitinous exoskeleton. Gills, trachea, and book lungs facilitate respiration. Sexual dimorphism is seen in this phylum, and embryonic development includes multiple larval stages.
End of Section Review Questions:
REVIEW: Arthropods
REVIEW: Nematodes
Footnotes
1. [1] Stoll, N. R., “This wormy world. 1947,” Journal of Parasitology 8=m /lkmaD
Learning Goals:
By the end of this reading, you should be able to:
- List the synapomorphic traits of the Superphylas Lophotrochozoa and Ecdysozoa
- Describe the key features of Platyhelminthes
- Discuss the shared characteristics of mollusks and the unique features of Bivalvia, Gastropoda, and Cephalopoda classes
- Describe the features of animals classified in phylum Annelida and discuss the advantages of body segmentation
- Compare the features of Nematodes and Annelids
- Describe the internal systems and appendage specializations of phylum Arthropoda
- Discuss the reasons for arthropod success and abundance
Introduction
Protostomes are animals whose blastopore (initiated by gastrulation) becomes the mouth of the future digestive system. This is called protostomy or “first mouth.” In protostomy, solid groups of cells split from the endoderm or inner germ layer to form a central mesodermal layer of cells. This layer multiplies into a band and then splits internally to form the coelom; this protostomic coelom is hence termed schizocoelom. Based on molecular evidence, protostomes are divided into two major groups. Lophotrochozoans are characterized by either the presence at some point in the organism's development of a lophophore (ciliated, horse-shoe feeding shaped structure) or a trochophore larval stage (free-swimming planktonic marine larva with several bands of cilia). Ecdysozoans are characterized by ecdysis, a feature in which the organism molts its exoskeleton as it grows.
Superphylum Lophotrochozoa
As lophotrochozoans, the organisms in this superphylum possess either a lophophore or trochophore larvae. The lophophores are a set of ciliated tentacles surrounding the mouth. Trochophore larvae are characterized by two bands of cilia around the body.
The lophotrochozoans are triploblastic and thus possess an embryonic mesoderm sandwiched between the ectoderm and endoderm which is not found in the diploblastic cnidarians. These phyla are also bilaterally symmetrical, meaning that a longitudinal section will divide them into right and left sides that are symmetrical. It also indicates the beginning of cephalization, the evolution of a concentration of nervous tissues and sensory organs in the head of the organism, which is where it first encounters its environment.
Phyla of this superphylum include Platyhelminthes (platy = flat, helminth = worm; flatworms), Rotifera (rotifers), Nemertea (ribbon worms), Mollusca (mollusks), and Annelida (segmented worms). Ecdysozoans include the phyla Nematoda (roundworms) and Arthropoda, the largest animal phylum in the world that include the subphyla Hexapoda (insects), Myriapoda (centipedes and millipedes), Crustacea (crustaceans), and Chelicerata (spiders, ticks, scorpions, etc.). For the sake of this course, we will only focus on the groups and material for which you are responsible.
Phylum Platyhelminthes
The flatworms are acoelomate organisms that include many free-living and parasitic forms. Flatworms have three embryonic tissue layers that give rise to surfaces that cover tissues (from ectoderm), internal tissues (from mesoderm), and line the digestive system (from endoderm). Their bodies are solid between the outer surface and the cavity of the digestive system. The free-living species of flatworms are predators or scavengers. Parasitic forms feed on the tissues of their hosts.
Most flatworms have a gastrovascular cavity rather than a complete digestive system. In such animals, the “mouth” is also used to expel waste materials from the digestive system. Digestion is extracellular, with digested materials taken into the cells of the gut lining by phagocytosis. The nervous system consists of a pair of nerve cords running the length of the body with connections between them and a large ganglion or concentration of nerves at the anterior end of the worm, where there may also be a concentration of photosensory and chemosensory cells.
There is neither a circulatory nor respiratory system, with gas and nutrient exchange dependent on diffusion and cell-cell junctions. This necessarily limits the thickness of the body in these organisms, constraining them to be “flat” worms. Most flatworm species are monoecious, and fertilization is typically internal. Asexual reproduction is common in some groups.
Review Question:
Quick Review: Platyhelminthes
Phylum Mollusca
Mollusca is the predominant phylum in marine environments. It is estimated that 23 percent of all known marine species are mollusks; there are over 75,000 described species, making them the second most diverse phylum of animals. The name “Mollusca” signifies a soft body since the earliest descriptions of mollusks came from observations of unshelled cuttlefish. Mollusks are predominantly a marine group of animals; however, they are known to inhabit freshwater as well as terrestrial habitats. Mollusks display a wide range of morphologies in each class and subclass, but share a few key characteristics, including a muscular foot, a visceral mass containing internal organs, and a mantle that may or may not secrete a shell of calcium carbonate.
The muscular foot is used for locomotion and anchorage, and varies in shape and function, depending on the type of mollusk. In shelled mollusks, this foot is usually the same size as the opening of the shell. The foot is a retractable as well as an extendable organ. The foot is the ventral-most organ, whereas the mantle is the limiting dorsal organ.
The visceral mass is present above the foot, in the visceral hump. This includes the digestive, nervous, excretory, reproductive, and respiratory systems. Mollusk species that are exclusively aquatic have gills for respiration, whereas some terrestrial species have lungs for respiration. Additionally, a tongue-like organ called a radula, which bears chitinous tooth-like ornamentation, is present in many species and serves to shred or scrape food. The mantle is the dorsal epidermis in mollusks; shelled mollusks are specialized to secrete a chitinous and hard calcareous shell. Mollusks are eucoelomate, but the coelomic cavity is restricted to a cavity around the heart in adult animals. The mantle cavity develops independently of the coelomic cavity.
Classification of Phylum Mollusca
Phylum Mollusca is a very diverse (85,000 species) group with a dramatic variety of forms, ranging from large predatory squids and octopuses, some of which show a high degree of intelligence, to grazing forms with elaborately sculpted and colored shells. While this phylum can be segregated into seven classes: Aplacophora, Monoplacophora, Polyplacophora, Bivalvia, Gastropoda, Cephalopoda, and Scaphopoda. this section will only focus on the classes Bivalvia, Gastropoda, and Cephalopoda.
Class Bivalvia
Bivalves (“two shells”) include clams, oysters, mussels, scallops, and geoducks that found in marine as well as freshwater habitats. As the name suggests, bivalves are enclosed in a pair of shells (valves are commonly called “shells”) that are hinged at the dorsal end by shell ligaments as well as shell teeth. The overall morphology is laterally flattened, and the head region is poorly developed. Eyespots and statocysts may be absent in some species. Since these animals are suspension feeders, a radula is absent in this class of mollusks. Respiration is facilitated by a pair of ctenidia, whereas excretion and osmoregulation are brought about by a pair of nephridia. Bivalves often possess a large mantle cavity. In some species, the posterior edges of the mantle may fuse to form two siphons that serve to take in and exude water.
One of the functions of the mantle is to secrete the shell. Some bivalves like oysters and mussels possess the unique ability to secrete and deposit a calcareous nacre or “mother of pearl” around foreign particles that may enter the mantle cavity. This property has been commercially exploited to produce pearls.
Class Gastropoda
Animals in class Gastropoda (“stomach foot”) include well-known mollusks like snails, slugs, conchs, sea hares, and sea butterflies. Gastropoda includes shell-bearing species as well as species with a reduced shell. These animals are asymmetrical and usually present a coiled shell. Shells may be planospiral (like a garden hose wound up), commonly seen in garden snails, or conispiral, (like a spiral staircase), commonly seen in marine conches.
The visceral mass in the shelled species displays torsion around the perpendicular axis on the center of the foot, which is the key characteristic of this group, along with a foot that is modified for crawling. Most gastropods bear a head with tentacles, eyes, and a style. A complex radula is used by the digestive system and aids in the ingestion of food. Eyes may be absent in some gastropods species. The mantle cavity encloses the ctenidia as well as a pair of nephridia.
Class Cephalopoda
Class Cephalopoda (“head foot” animals) include octopi, squids, cuttlefish, and nautilus. Cephalopods are a class of shell-bearing animals as well as mollusks with a reduced shell. They display vivid coloration, typically seen in squids and octopi, which is used for camouflage. All animals in this class are carnivorous predators and have beak-like jaws at the anterior end. All cephalopods show the presence of a very well-developed nervous system along with eyes, as well as a closed circulatory system. The foot is lobed and developed into tentacles, and a funnel, which is used as their mode of locomotion. Suckers are present on the tentacles in octopi and squid. Ctenidia are enclosed in a large mantle cavity and are serviced by large blood vessels, each with its own heart associated with it; the mantle has siphonophores that facilitate the exchange of water.
Locomotion in cephalopods is facilitated by ejecting a stream of water for propulsion. This is called “jet” propulsion. A pair of nephridia is present within the mantle cavity. Sexual dimorphism is seen in this class of animals. Members of a species mate, and the female then lays the eggs in a secluded and protected niche. Females of some species care for the eggs for an extended period of time and may end up dying during that time period. Cephalopods such as squids and octopi also produce sepia or a dark ink, which is squirted upon a predator to assist in a quick getaway.
Reproduction in cephalopods is different from other mollusks in that the egg hatches to produce a juvenile adult without undergoing the trochophore and veliger larval stages.
In the shell-bearing Nautilus spp., the spiral shell is multi-chambered. These chambers are filled with gas or water to regulate buoyancy. The shell structure in squids and cuttlefish is reduced and is present internally in the form of a squid pen and cuttlefish bone, respectively.
Review Question:
Phylum Annelida
Annelids include segmented worms which comprise the class Polychaeta (the polychaetes) and the class Oligochaeta (the earthworms, leeches, and their relatives). These animals are found in marine, terrestrial, and freshwater habitats, but the presence of water or humidity is a critical factor for their survival, especially in terrestrial habitats. The name of the phylum is derived from the Latin word annellus, which means a small ring. Approximately 16,500 species have been described in phylum Annelida, some of which show parasitic and commensal symbioses with other species in their habitat. The phylum includes earthworms, polychaete worms, and leeches. Annelids show protostomic development in embryonic stages and are often called “segmented worms” due to their key characteristic of metamerism, or true segmentation.
Annelids display bilateral symmetry and are worm-like in overall morphology. Annelids have a segmented body plan wherein the internal and external morphological features are repeated in each body segment. Metamerism allows animals to become bigger by adding “compartments” while making their movement more efficient. The epidermis is protected by an acellular, external cuticle, but this is much thinner than the cuticle found in the ecdysozoans and does not require periodic shedding for growth. Annelids show the presence of a true coelom, derived from embryonic mesoderm and protostomy. Hence, they are the most advanced worms. A well-developed and complete digestive system is present in earthworms (oligochaetes) with a mouth, muscular pharynx, esophagus, crop, and gizzard being present. The gizzard leads to the intestine and ends in an anal opening. Each segment is limited by a membranous septum that divides the coelomic cavity into a series of compartments.
Annelids possess a closed circulatory system (fluid of the circulatory system always remains in vessels and never bathes the tissues directly, as in an open circulatory system) of dorsal and ventral blood vessels that run parallel to the alimentary canal as well as capillaries that service individual tissues. In addition, these vessels are connected by transverse loops in every segment. These animals lack a well-developed respiratory system, and gas exchange occurs across the moist body surface. Excretion is facilitated by a pair of metanephridia (a type of primitive “kidney” that consists of a convoluted tubule and an open, ciliated funnel) that is present in every segment towards the ventral side. Annelids show well-developed nervous systems with a nerve ring of fused ganglia present around the pharynx. The nerve cord is ventral in position and bears enlarged nodes or ganglia in each segment.
Review Question:
Quick Review: annelids
Superphylum Ecdysozoa
The superphylum Ecdysozoa contains an incredibly large number of species. This is because it contains two of the most diverse animal groups: phylum Nematoda (the roundworms) and Phylum Arthropoda (the arthropods). The most prominent distinguishing feature of Ecdysozoans is their tough external covering called the cuticle. The cuticle provides a tough, but flexible exoskeleton that protects these animals from water loss, predators, and other aspects of the external environment. All members of this superphylum periodically molt, or shed their cuticle as they grow. After molting, they secrete a new cuticle that will last until their next growth phase. The process of molting and replacing the cuticle is called ecdysis, which is how the superphylum derived its name.
Phylum Nematoda
The Nematoda, like most other animal phyla, are triploblastic and possess an embryonic mesoderm and are bilaterally symmetrical. Furthermore, the nematodes, or roundworms, possess a pseudocoelom and consist of both free-living and parasitic forms. This phylum includes more than 28,000 species with an estimated 16,000 being parasitic in nature. The name Nematoda is derived from the Greek word “Nemos,” which means “thread” and includes roundworms. Nematodes are present in all habitats with a large number of individuals of each species present in each.
Nematodes show a tubular morphology and circular cross-section. These animals are pseudocoelomates and show the presence of a complete digestive system with a distinct mouth and anus. The head is radially symmetrical. A mouth opening is present at the anterior end with three or six lips as well as teeth in some species in the form of cuticle extensions. Some nematodes may present other external modifications like rings, head shields, or warts. Rings, however, do not reflect true internal body segmentation. The mouth leads to a muscular pharynx and intestine, which leads to a rectum and anal opening at the posterior end. The muscles of nematodes differ from those of most animals: They have a longitudinal layer only, which accounts for the whip-like motion of their movement. Most nematodes possess four longitudinal nerve cords that run along the length of the body in dorsal, ventral, and lateral positions. The ventral nerve cord is better developed than the dorsal or lateral cords. All nerve cords fuse at the anterior end, around the pharynx, to form head ganglia or the “brain” of the worm (which take the form of a ring around the pharynx) as well as at the posterior end to form the tail ganglia. In C. elegans, the nervous system accounts for nearly one-third of the total number of cells in the animal.
Phylum Arthropoda
The name “Arthropoda” means “jointed legs” (in Greek, “arthros” means “joint” and “podos” means “leg”); it aptly describes the enormous number of invertebrates included in this phylum. Arthropoda dominates the animal kingdom with an estimated 85 percent of known species included in this phylum and many arthropods yet undocumented. The principal characteristics of all the animals in this phylum are functional segmentation of the body and the presence of jointed appendages. Arthropods also show the presence of an exoskeleton made principally of chitin, which is a waterproof, tough polysaccharide. Phylum Arthropoda is the largest phylum in the animal world, and insects form the single largest class within this phylum. Arthropods are eucoelomate, protostomic organisms.
Phylum Arthropoda includes animals that have been successful in colonizing terrestrial, aquatic, and aerial habitats. This phylum is further classified into five subphyla: Trilobitomorpha (trilobites, all extinct), Hexapoda (insects and relatives), Myriapoda (millipedes, centipedes, and relatives), Crustaceans (crabs, lobsters, crayfish, isopods, barnacles, and some zooplankton), and Chelicerata (horseshoe crabs, arachnids, scorpions, and daddy longlegs).
A unique feature of animals in the arthropod phylum is the presence of a segmented body and the fusion of sets of segments that give rise to functional body regions called tagma. Tagma may be in the form of a head, thorax, and abdomen, or a cephalothorax and abdomen, or a head and trunk. A central cavity, called the hemocoel (or blood cavity), is present, and the open circulatory system is regulated by a tubular or single-chambered heart. Respiratory systems vary depending on the group of arthropod: insects and myriapods use a series of tubes (tracheae) that branch through the body, open to the outside through openings called spiracles, and perform gas exchange directly between the cells and air in the tracheae, whereas aquatic crustaceans utilize gills, terrestrial chelicerates employ book lungs, and aquatic chelicerates use book gills.
The book lungs of arachnids (scorpions, spiders, ticks, and mites) contain a vertical stack of hemocoel wall tissue that somewhat resembles the pages of a book. Between each of the "pages" of tissue is an air space. This allows both sides of the tissue to be in contact with the air at all times, greatly increasing the efficiency of gas exchange. The gills of crustaceans are filamentous structures that exchange gases with the surrounding water. Groups of arthropods also differ in the organs used for excretion, with crustaceans possessing green glands and insects using Malpighian tubules, which work in conjunction with the hindgut to reabsorb water while ridding the body of nitrogenous waste.
The cuticle is the covering of an arthropod. It is made up of two layers: the epicuticle, which is a thin, waxy water-resistant outer layer containing no chitin, and the layer beneath it, the chitinous procuticle. Chitin is a tough, flexible polysaccharide. In order to grow, the arthropod must shed the exoskeleton during a process called ecdysis (“to strip off”); this is a cumbersome method of growth, and during this time, the animal is vulnerable to predation. The characteristic morphology of representative animals from each subphylum is described below.
Subphylum Hexapoda
The name Hexapoda denotes the presence of six legs (three pairs) in these animals as differentiated from the number of pairs present in other arthropods. Hexapods are characterized by the presence of a head, thorax, and abdomen, constituting three tagma. The thorax bears the wings as well as six legs in three pairs. Many of the common insects we encounter on a daily basis—including ants, cockroaches, butterflies, and flies—are examples of Hexapoda.
Amongst the hexapods, the insects are the largest class in terms of species diversity as well as biomass in terrestrial habitats. Typically, the head bears one pair of sensory antennae, mandibles as mouthparts, a pair of compound eyes, and some ocelli (simple eyes) along with numerous sensory hairs. The thorax bears three pairs of legs (one pair per segment) and two pairs of wings, with one pair each on the second and third thoracic segments. The abdomen usually has eleven segments and bears reproductive apertures. Hexapoda includes insects that are winged (like fruit flies) and wingless (like fleas).
Subphylum Myriapoda
Subphylum Myriapoda includes arthropods with numerous legs. Although the name is hyperbolic in suggesting that myriad legs are present in these invertebrates, the number of legs may vary from 10 to 750. This subphylum includes 13,000 species; the most commonly found examples are millipedes and centipedes. All myriapods are terrestrial animals and prefer a humid environment.
Myriapods are typically found in moist soils, decaying biological material, and leaf litter. Subphylum Myriapoda is divided into four classes: Chilopoda, Symphyla, Diplopoda, and Pauropoda. Centipedes like Scutigera coleoptrata) are classified as chilopods. These animals bear one pair of legs per segment, mandibles as mouthparts, and are somewhat dorsoventrally flattened. The legs in the first segment are modified to form forcipules (poison claws) that deliver poison to prey like spiders and cockroaches, as these animals are all predatory. Millipedes bear two pairs of legs per diplosegment, a feature that results from the embryonic fusion of adjacent pairs of body segments, are usually rounder in cross-section, and are herbivores or detritivores. Millipedes have visibly more numbers of legs as compared to centipedes, although they do not bear a thousand legs
Subphylum Crustacea
Crustaceans are the most dominant aquatic arthropods since the total number of marine crustacean species stands at 67,000, but there are also freshwater and terrestrial crustacean species. Krill, shrimp, lobsters, crabs, and crayfish are examples of crustaceans. Terrestrial species like the woodlice (Armadillidium spp.) (also called pill bugs, rolly pollies, potato bugs, or isopods) are also crustaceans, although the number of non-aquatic species in this subphylum is relatively low.
Crustaceans possess two pairs of antennae, mandibles as mouthparts, and biramous (“two-branched”) appendages, which means that their legs are formed in two parts, as distinct from the uniramous (“one branched”) myriapods and hexapods.
Unlike that of the Hexapoda, the head and thorax of most crustaceans are fused to form a cephalothorax, which is covered by a plate called the carapace, thus producing a body structure of two tagmata. Crustaceans have a chitinous exoskeleton that is shed by molting whenever the animal increases in size. The exoskeletons of many species are also infused with calcium carbonate, which makes them even stronger than in other arthropods. Crustaceans have an open circulatory system where blood is pumped into the hemocoel by the dorsally located heart. Hemocyanin and hemoglobin are the respiratory pigments present in these animals.
Most crustaceans are dioecious, which means that the sexes are separate. Some species like barnacles may be hermaphrodites. Serial hermaphroditism, where the gonad can switch from producing sperm to ova, may also be seen in some species. Fertilized eggs may be held within the female of the species or may be released in the water. Terrestrial crustaceans seek out damp spaces in their habitats to lay eggs.
Larval stages—nauplius and zoea—are seen in the early development of crustaceans. A cypris larva is also seen in the early development of barnacles. Crustaceans possess a tripartite brain and two compound eyes. Most crustaceans are carnivorous, but herbivorous and detritivorous species are also known. Crustaceans may also be cannibalistic when extremely high populations of these organisms are present.
This subphylum includes animals such as spiders, scorpions, horseshoe crabs, and sea spiders. This subphylum is predominantly terrestrial, although some marine species also exist. An estimated 77,000 species are included in the subphylum Chelicerata. Chelicerates are found in almost all habitats.
The body of chelicerates may be divided into two parts: prosoma and opisthosoma, which are basically the equivalents of the cephalothorax (usually smaller) and abdomen (usually larger). A “head” tagmum is not usually discernible. The phylum derives its name from the first pair of appendages: the chelicerae, which are specialized, claw-like or fang-like mouthparts. These animals do not possess antennae. The second pair of appendages is known as pedipalps. In some species, like sea spiders, an additional pair of appendages, called ovigers, is present between the chelicerae and pedipalps.
Chelicerae are mostly used for feeding, but in spiders, these are often modified into fangs that inject venom into their prey before feeding. Members of this subphylum have an open circulatory system with a heart that pumps blood into the hemocoel. Aquatic species have gills, whereas terrestrial species have either trachea or book lungs for gaseous exchange.
Most chelicerates ingest food using a preoral cavity formed by the chelicerae and pedipalps. Some chelicerates may secrete digestive enzymes to pre-digest food before ingesting it. Parasitic chelicerates like ticks and mites have evolved blood-sucking apparatuses.
The nervous system in chelicerates consists of a brain and two ventral nerve cords. These animals use external fertilization as well as internal fertilization strategies for reproduction, depending upon the species and its habitat. Parental care for the young ranges from absolutely none to relatively prolonged care.
Visit https://evolution.berkeley.edu/evolibrary/article/arthropodstory to click through a lesson on arthropods, including interactive habitat maps, and more.
Summary
Phylum Annelida includes vermiform, segmented animals. Segmentation is seen in internal anatomy as well, which is called metamerism. Annelids are protostomes. These animals have well-developed neuronal and digestive systems. Some species bear a specialized band of segments known as a clitellum.
Flatworms are acoelomate, triploblastic animals. They lack circulatory and respiratory systems and have a rudimentary excretory system. This digestive system is incomplete in most species. Cestodes, or tapeworms, infect the digestive systems of primary vertebrate hosts.
Phylum Mollusca is a large, marine group of invertebrates. Mollusks show a variety of morphological variations within the phylum. This phylum is also distinct in that some members exhibit a calcareous shell as an external means of protection. Some mollusks have evolved a reduced shell. Mollusks are protostomes. The dorsal epidermis in mollusks is modified to form the mantle, which encloses the mantle cavity and visceral organs. This cavity is quite distinct from the coelomic cavity, which in the adult animal surrounds the heart. Respiration is facilitated by gills known as ctenidia. A chitinous-toothed tongue called the radula is present in most mollusks. Early development in some species occurs via two larval stages: trochophore and veliger.
Nematodes are pseudocoelomate animals akin to flatworms, yet display more advanced neuronal development, a complete digestive system, and a body cavity. A peculiar feature of nematodes is the secretion of a collagenous/chitinous cuticle outside the body.
Arthropods represent the most successful phylum of animals on Earth, in terms of the number of species as well as the number of individuals. These animals are characterized by a segmented body as well as the presence of jointed appendages. In the basic body plan, a pair of appendages is present per body segment. Within the phylum, traditional classification is based on mouthparts, a number of appendages, and modifications of appendages present. Arthropods bear a chitinous exoskeleton. Gills, trachea, and book lungs facilitate respiration. Sexual dimorphism is seen in this phylum, and embryonic development includes multiple larval stages.
End of Section Review Questions:
REVIEW: Arthropods
REVIEW: Nematodes
Footnotes
1. [1] Stoll, N. R., “This wormy world. 1947,” Journal of Parasitology 8=m /lkmaD
Learning Goals Chapter Outline
- Describe the distinguishing characteristics of echinoderms
- Describe the distinguishing characteristics of chordates
- Identify the derived character of craniates that sets them apart from other chordates
- Describe the developmental fate of the notochord in vertebrates
The phyla Echinodermata and Chordata (the phylum in which humans are placed) both belong to the superphylum Deuterostomia. Recall that protostome and deuterostomes differ in certain aspects of their embryonic development, and they are named based on which opening of the digestive cavity develops first. The word deuterostome comes from the Greek word meaning “mouth second,” indicating that the anus is the first to develop. There are a series of other developmental characteristics that differ between protostomes and deuterostomes, including the mode of formation of the coelom and the early cell division of the embryo. In deuterostomes, internal pockets of the endodermal lining called the archenteron fuse to form the coelom. The endodermal lining of the archenteron (or the primitive gut) forms membrane protrusions that bud off and become the mesodermal layer. These buds, known as coelomic pouches, fuse to form the coelomic cavity, as they eventually separate from the endodermal layer. The resultant coelom is termed an enterocoelom. The archenteron develops into the alimentary canal, and a mouth opening is formed by invagination of ectoderm at the pole opposite the blastopore of the gastrula. The blastopore forms the anus of the alimentary system in the juvenile and adult forms. The fates of embryonic cells in deuterostomes can be altered if they are experimentally moved to a different location in the embryo due to indeterminate cleavage in early embryogenesis.
Phylum Echinodermata
Echinodermata are so named owing to their spiny skin (from the Greek “echinos” meaning “spiny” and “dermos” meaning “skin”), and this phylum is a collection of about 7,000 described living species. Echinodermata are exclusively marine organisms. Sea stars (Fig. 1), sea cucumbers, sea urchins, sand dollars, and brittle stars are all examples of echinoderms. To date, no freshwater or terrestrial echinoderms are known.
Morphology and Anatomy
Adult echinoderms exhibit pentaradial symmetry and have a calcareous endoskeleton made of ossicles, although the early larval stages of all echinoderms have bilateral symmetry. The endoskeleton is developed by epidermal cells and may possess pigment cells, giving vivid colors to these animals, as well as cells laden with toxins. Gonads are present in each arm. In echinoderms like sea stars, every arm bears two rows of tube feet on the oral side. These tube feet help in attachment to the substratum. These animals possess a true coelom that is modified into a unique circulatory system called a water vascular system. An interesting feature of these animals is their power to regenerate, even when over 75 percent of their body mass is lost.

Water Vascular System
Echinoderms possess a unique ambulacral or water vascular system, consisting of a central ring canal and radial canals that extend along each arm. Water circulates through these structures and facilitates gaseous exchange as well as nutrition, predation, and locomotion. The water vascular system also projects from holes in the skeleton in the form of tube feet. These tube feet can expand or contract based on the volume of water present in the system of that arm. By using hydrostatic pressure, the animal can either protrude or retract the tube feet. Water enters the madreporite on the aboral side of the echinoderm. From there, it passes into the stone canal, which moves water into the ring canal. The ring canal connects the radial canals (there are five in a pentaradial animal), and the radial canals move water into the ampullae, which have tube feet through which the water moves. By moving water through the unique water vascular system, the echinoderm can move and force open mollusk shells during feeding.
Nervous System
The nervous system in these animals is a relatively simple structure with a nerve ring at the center and five radial nerves extending outward along the arms. Structures analogous to a brain or derived from fusion of ganglia are not present in these animals.
Excretory System
Podocytes, cells specialized for ultrafiltration of bodily fluids, are present near the center of echinoderms. These podocytes are connected by an internal system of canals to an opening called the madreporite.
Reproduction
Echinoderms are sexually dimorphic and release their eggs and sperm cells into the water; fertilization is external. In some species, the larvae divide asexually and multiply before they reach sexual maturity. Echinoderms may also reproduce asexually, as well as regenerate body parts lost in trauma.
Classes of Echinoderms
This phylum is divided into five extant classes: Asteroidea (sea stars), Ophiuroidea (brittle stars), Echinoidea (sea urchins and sand dollars), Crinoidea (sea lilies or feather stars), and Holothuroidea (sea cucumbers) (Fig. 2).
The most well-known echinoderms are members of class Asteroidea, or sea stars. They come in a large variety of shapes, colors, and sizes, with more than 1,800 species known so far. The key characteristic of sea stars that distinguishes them from other echinoderm classes includes thick arms (ambulacra) that extend from a central disk where organs penetrate into the arms. Sea stars use their tube feet not only for gripping surfaces but also for grasping prey. Sea stars have two stomachs, one of which can protrude through their mouths and secrete digestive juices into or onto prey, even before ingestion. This process can essentially liquefy the prey and make digestion easier. Explore the sea star’s body plan (http://openstaxcollege.org/l/sea_star) up close, watch one move across the seafloor, and see it devour a mussel.
Brittle stars belong to the class Ophiuroidea. Unlike sea stars, which have plump arms, brittle stars have long, thin arms that are sharply demarcated from the central disk. Brittle stars move by lashing out their arms or wrapping them around objects and pulling themselves forward. Sea urchins and sand dollars are examples of Echinoidea. These echinoderms do not have arms, but are hemispherical or flattened with five rows of tube feet that help them in slow movement; tube feet are extruded through pores of a continuous internal shell called a test. Sea lilies and feather stars are examples of Crinoidea. Both of these species are suspension feeders. Sea cucumbers of class Holothuroidea are extended in the oral-aboral axis and have five rows of tube feet. These are the only echinoderms that demonstrate “functional” bilateral symmetry as adults because the uniquely extended oral-aboral axis compels the animal to lie horizontally rather than stand vertically.
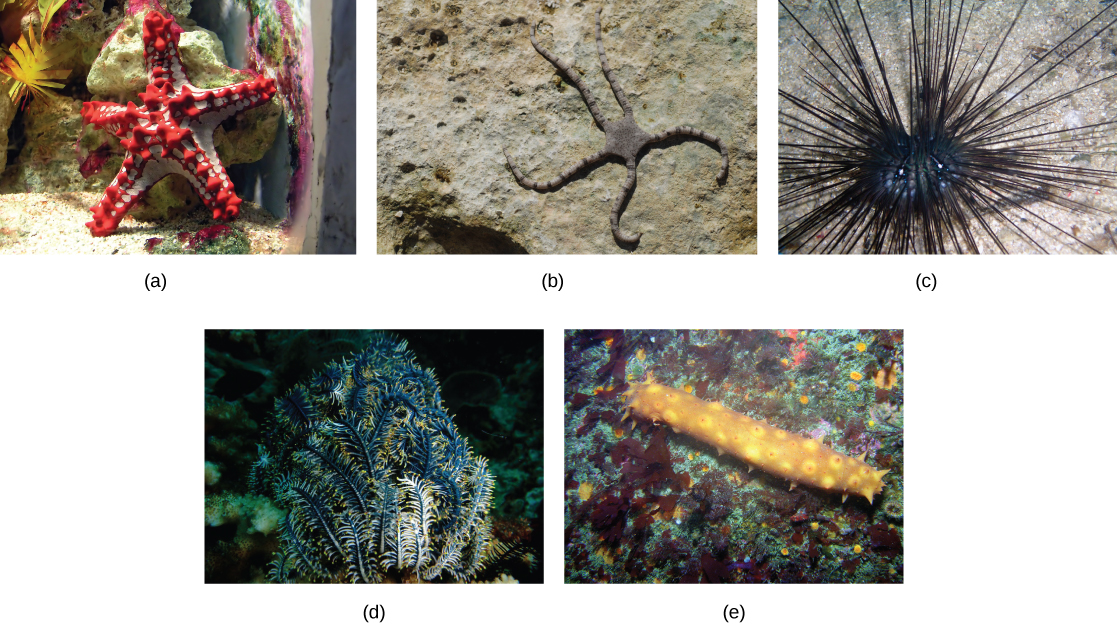
Review Question:
Echinoderm Review 2
Phylum Chordata
Animals in the phylum Chordata (Fig. 3) share five key features that appear at some stage of their development: a notochord, a dorsal hollow nerve cord, pharyngeal slits, a post-anal tail, and an endostyle. In some groups, some of these traits are present only during embryonic development. In addition to containing vertebrate classes, the phylum Chordata contains two clades of invertebrates: Urochordata (tunicates) and Cephalochordata (lancelets). Most tunicates live on the ocean floor and are suspension feeders. Lancelets are suspension feeders that feed on phytoplankton and other microorganisms.
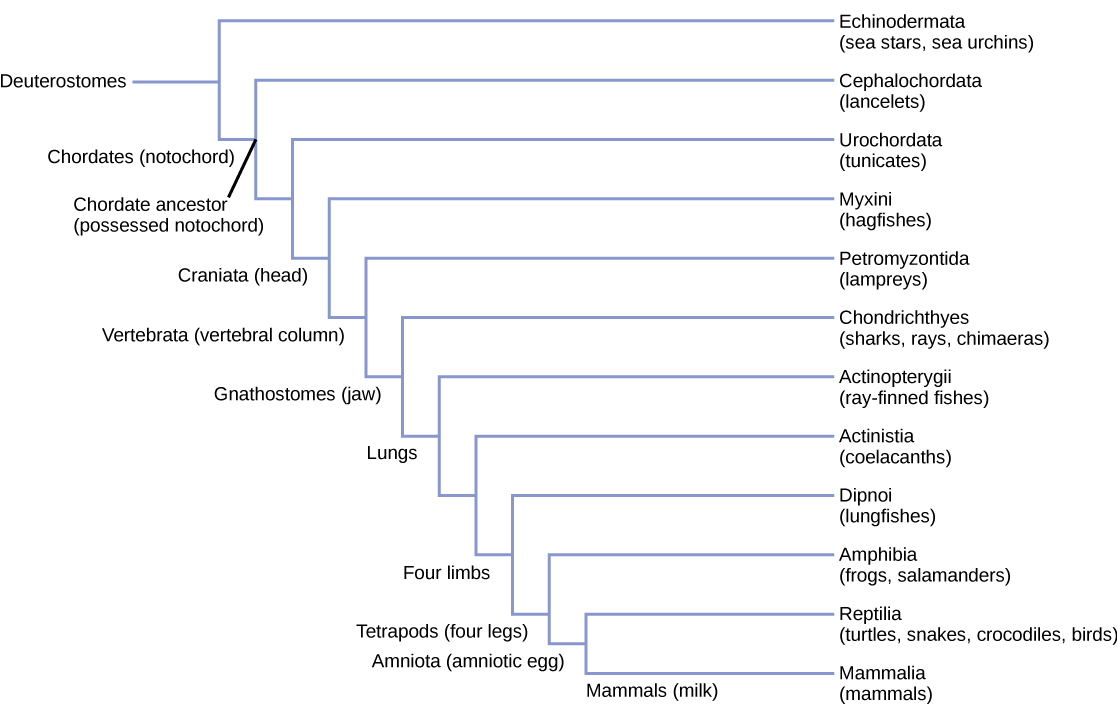
Characteristics of Chordata
Animals in the phylum Chordata share five key features that appear at some stage during their development: a notochord, a dorsal hollow nerve cord, pharyngeal slits, post-anal tail, and an endostyle (Fig. 4). In some groups, some of these are present only during embryonic development.
The chordates are named for the notochord, which is a flexible, rod-shaped structure that is found in the embryonic stage of all chordates and in the adult stage of some chordate species. It is located between the digestive tube and the nerve cord and provides skeletal support through the length of the body. In some chordates, the notochord acts as the primary axial support of the body throughout the animal’s lifetime. In vertebrates, the notochord is present during embryonic development, at which time it induces the development of the neural tube and serves as a support for the developing embryonic body. The notochord, however, is not found in the postnatal stage of vertebrates; at this point, it has been replaced by the vertebral column (that is, the spine).
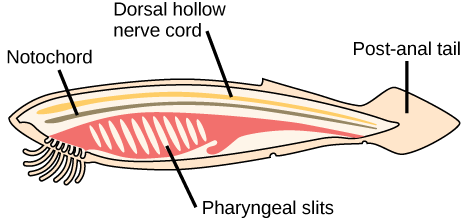
Review Question:
The dorsal hollow nerve cord derives from ectoderm that rolls into a hollow tube during development. In chordates, it is located dorsal to the notochord. In contrast, other animal phyla are characterized by solid nerve cords that are located either ventrally or laterally. The nerve cord found in most chordate embryos develops into the brain and spinal cord, which compose the central nervous system.
Pharyngeal slits are openings in the pharynx (the region just posterior to the mouth; in you, it's your throat/neck region) that extend to the outside environment. In organisms that live in aquatic environments, pharyngeal slits allow for the exit of water that enters the mouth during feeding. Some invertebrate chordates use the pharyngeal slits to filter food out of the water that enters the mouth. In vertebrate fishes, the pharyngeal slits are modified into gill supports, and in jawed fishes, into jaw supports. In tetrapods, the slits are modified into components of the ear and tonsils. Tetrapod literally means “four-footed,” which refers to the phylogenetic history of various groups that evolved accordingly, even though some now possess fewer than two pairs of walking appendages. Tetrapods include amphibians, reptiles, birds, and mammals.
The post-anal tail is a posterior elongation of the body, extending beyond the anus. The tail contains skeletal elements and muscles, which provide a source of locomotion in aquatic species, such as fishes. In some terrestrial vertebrates, the tail also helps with balance, courting, and signaling when danger is near. In humans, the post-anal tail is vestigial, that is, reduced in size and nonfunctional.
The endostyle is a structure that develops on the floor of the pharynx. In more primitive chordates, it helps to capture food as they are filter feeders. In more recently evolved chordates the endostyle becomes the thyroid gland, an organ that secretes hormones that primarily influence the metabolic rate and protein synthesis.
Click for a video (http://openstaxcollege.org/l/chordate_evol) discussing the evolution of chordates and five characteristics that they share.
Chordates and the Evolution of Vertebrates
Chordata also contains two clades of invertebrates: Urochordata and Cephalochordata. Members of these groups also possess the four distinctive features of chordates at some point during their development.
Urochordata
Members of Urochordata are also known as tunicates (Figure 5). The name tunicate derives from the cellulose-like carbohydrate material, called the tunic, which covers the outer body of tunicates. Although adult tunicates are classified as chordates, they do not have a notochord, a dorsal hollow nerve cord, or a post-anal tail, although they do have pharyngeal slits. The larval form, however, possesses all four structures. Most tunicates are hermaphrodites. Tunicate larvae hatch from eggs inside the adult tunicate’s body. After hatching, a tunicate larva swims for a few days until it finds a suitable surface on which it can attach, usually in a dark or shaded location. It then attaches via the head to the surface and undergoes metamorphosis into the adult form, at which point the notochord, nerve cord, and tail disappear.
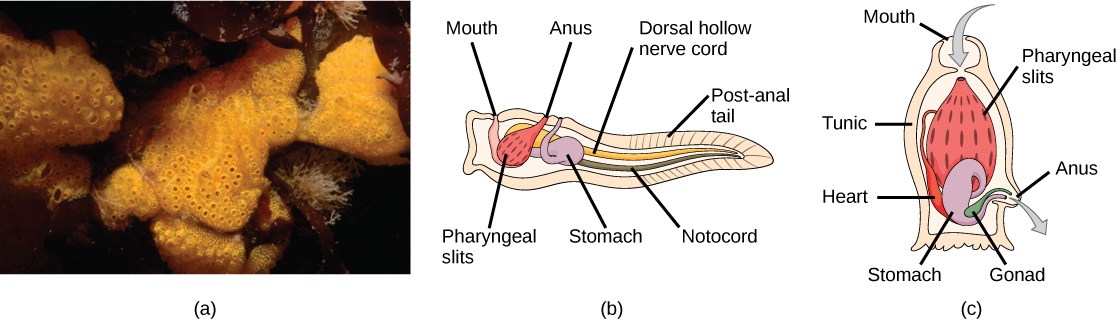
Most tunicates live a sessile existence on the ocean floor and are suspension feeders. The primary foods of tunicates are plankton and detritus. Seawater enters the tunicate’s body through its incurrent siphon. Suspended material is filtered out of this water by a mucous net (pharyngeal slits) and is passed into the intestine via the action of cilia. The anus empties into the excurrent siphon, which expels wastes and water. Tunicates are found in shallow ocean waters around the world.
Cephalochordata
Members of Cephalochordata possess a notochord, dorsal hollow nerve cord, pharyngeal slits, and a post-anal tail in the adult stage (Figure 6). The notochord extends into the head, which gives the subphylum its name. Extinct members of this subphylum include Pikaia, which is the oldest known cephalochordate. Pikaia fossils were recovered from the Burgess shales of Canada and dated to the middle of the Cambrian age, making them more than 500 million years old.
Extant members of Cephalochordata are the lancelets, named for their blade-like shape. Lancelets are only a few centimeters long and are usually found buried in sand at the bottom of warm temperate and tropical seas. Like tunicates, they are suspension feeders.
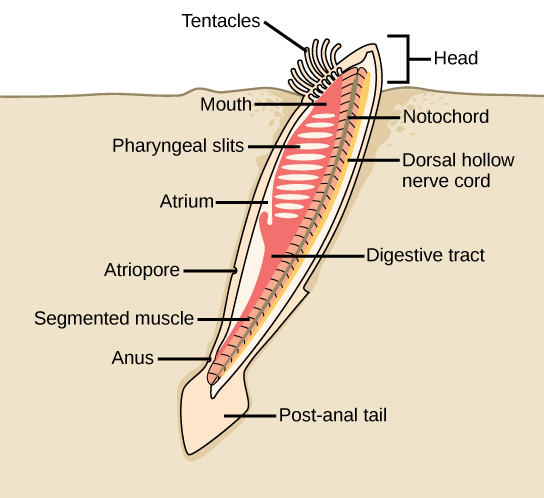
Craniata and Vertebrata
A cranium is a bony, cartilaginous, or fibrous structure surrounding the brain, jaw, and facial bones (Figure 7). Most bilaterally symmetrical animals have a head; of these, those that have a cranium compose the clade Craniata. Craniata includes the hagfishes (Myxini), which have a cranium but lack a backbone (AKA invertebrate, and all of the organisms called “vertebrates.”
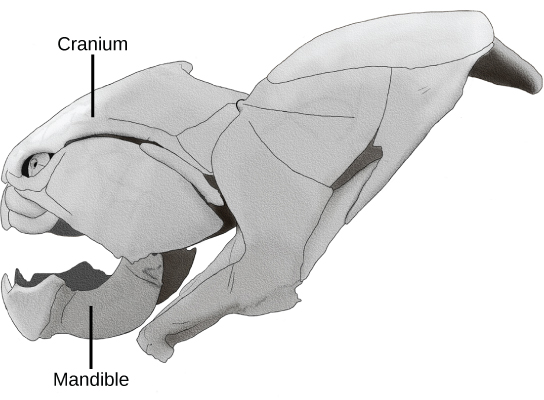
Vertebrates are members of the clade Vertebrata. Vertebrates display the five characteristic features of the chordates; however, members of this group also share derived characteristics that distinguish them from invertebrate chordates. Vertebrata is named for the vertebral column, composed of vertebrae, a series of separate bones joined together as a backbone (Fig. 8). In adult vertebrates, the vertebral column replaces the notochord, which is only seen in the embryonic stage.
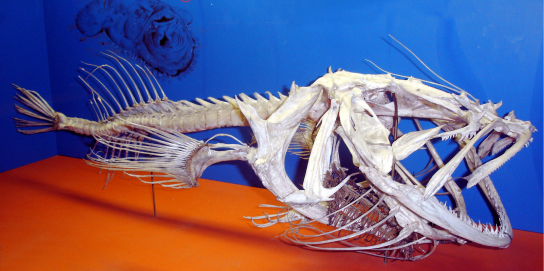
Based on molecular analysis, vertebrates appear to be more closely related to lancelets (cephalochordates) than to tunicates (urochordates) among the invertebrate chordates. This evidence suggests that the cephalochordates diverged from Urochordata and the vertebrates subsequently diverged from the cephalochordates. This hypothesis is further supported by the discovery of a fossil in China from the genus Haikouella. This organism seems to be an intermediate form between cephalochordates and vertebrates. The Haikouella fossils are about 530 million years old and appear similar to modern lancelets. These organisms had a brain and eyes, as do vertebrates, but lack the skull found in craniates.[1] This evidence suggests that vertebrates arose during the Cambrian explosion. Recall that the “Cambrian explosion” is the name given to a relatively brief span of time during the Cambrian period during which many animal groups appeared and rapidly diversified. Most modern animal phyla originated during the Cambrian explosion.
Vertebrates are the largest group of chordates, with more than 62,000 living species. Vertebrates are grouped based on anatomical and physiological traits. More than one classification and naming scheme is used for these animals. Here we will consider the traditional groups Agnatha, Chondrichthyes, Osteichthyes, Amphibia, Reptilia, Aves, and Mammalia, which constitute classes in the subphylum Vertebrata. Many modern authors classify birds within Reptilia, which correctly reflects their evolutionary heritage. We consider them separately only for convenience. Further, we will consider hagfishes and lampreys together as jawless fishes, the agnathans, although emerging classification schemes separate them into chordate jawless fishes (the hagfishes) and vertebrate jawless fishes (the lampreys).
Animals that possess jaws are known as gnathostomes, which means “jawed mouth.” Gnathostomes include fishes and tetrapods—amphibians, reptiles, birds, and mammals. Tetrapods can be further divided into two groups: amphibians and amniotes. Amniotes are animals whose eggs are adapted for terrestrial living, and this group includes mammals, reptiles, and birds. Amniotic embryos, developing in either an externally shed egg or an egg carried by the female, are provided with a water-retaining environment and are protected by amniotic membranes.
Review Question:
Review: Invertebrates and Vertebrates
Summary
Echinoderms are deuterostomic marine organisms. This phylum of animals bears a calcareous endoskeleton composed of ossicles. These animals also have spiny skin. Echinoderms possess water-based circulatory systems. A pore termed the madreporite is the point of entry and exit for water into the water vascular system. Osmoregulation is carried out by specialized cells known as podocytes. The characteristic features of Chordata are a notochord, a dorsal hollow nerve cord, pharyngeal slits, and a post-anal tail. Chordata contains two clades of invertebrates: Urochordata (tunicates) and Cephalochordata (lancelets), together with the vertebrates in Vertebrata. Most tunicates live on the ocean floor and are suspension feeders. Lancelets are suspension feeders that feed on phytoplankton and other microorganisms. Vertebrata is named for the vertebral column, which is a feature of almost all members of this clade.
End of Section Review Questions:
Review: Evolution of the jaw
References
1. [1] Chen, J. Y., Huang, D. Y., and Li, C. W., “An early Cambrian craniate-like chordate,” Nature 402 (1999): 518–522, doi:10.1038/990080.
2. [2] Daeschler, E. B., Shubin, N. H., and Jenkins, F. J. “A Devonian tetrapod-like fish and the evolution of the tetrapod body plan,” Nature 440 (2006): 757–763, doi:10.1038/nature04639, http://www.nature.com/nature/journal/v440/n7085/abs/nature04639.html.
