
6 Energy in ecosystems
Virtually every task performed by living organisms requires energy. Nutrients and other molecules are imported into the cell to meet these energy demands. For example, energy is required for the synthesis and breakdown of molecules, as well as the transport of molecules into and out of cells. In addition, processes such as ingesting and breaking down food, exporting wastes and toxins, and movement of the cell all require energy.
Scientists use the term bioenergetics to describe the concept of energy flow through living systems, such as cells. Cellular processes such as the building and breaking down of complex molecules occur through step-wise chemical reactions. Some of these chemical reactions are spontaneous and release energy, whereas others require energy to proceed. Together, all of the chemical reactions that take place inside cells, including those that consume or generate energy, are referred to as the cell’s metabolism.

Energy
Thermodynamics refers to the study of energy and energy transfer involving physical matter. The matter relevant to a particular case of energy transfer is called a system, and everything outside of that matter is called the surroundings. For instance, when heating a pot of water on the stove, the system includes the stove, the pot, and the water. Energy is transferred within the system (between the stove, pot, and water). There are two types of systems: open and closed. In an open system, energy can be exchanged with its surroundings. The stovetop system is open because heat can be lost to the air. A closed system cannot exchange energy with its surroundings.
Biological organisms are open systems. Energy is exchanged between them and their surroundings as they use energy from the sun to perform photosynthesis (explained later in this chapter) or consume energy-storing molecules and release energy to the environment by doing work and releasing heat. Like all things in the physical world, energy is subject to physical laws. The laws of thermodynamics govern the transfer of energy in and among all systems in the universe. In general, energy is defined as the ability to do work, or to create some kind of change. Energy exists in different forms: electrical energy, light energy, mechanical energy, and heat energy are all different types of energy. To appreciate the way energy flows into and out of biological systems, it is important to understand two of the physical laws that govern energy.
The first law of thermodynamics states that the total amount of energy in the universe is constant and conserved. In other words, there has always been, and always will be, exactly the same amount of energy in the universe. Energy exists in many different forms. According to the first law of thermodynamics, energy may be transferred from place to place or transformed into different forms, but it cannot be created or destroyed. The transfers and transformations of energy take place around us all the time. Light bulbs transform electrical energy into light and heat energy. Gas stoves transform chemical energy from natural gas into heat energy. Plants perform one of the most biologically useful energy transformations on earth, photosynthesis, which is converting the energy of sunlight to chemical energy stored within organic molecules. The image below shows examples of energy being transferred between objects and transformed.

The challenge for all living organisms is to obtain energy from their surroundings in forms that are usable to perform cellular work. Cells have evolved to meet this challenge. Chemical energy stored within organic molecules such as sugars and fats is transferred and transformed through a series of cellular chemical reactions into energy within molecules of ATP (adenosine triphosphate). Energy in ATP molecules is easily accessible to do work. Examples of the types of work that cells need to do include building complex molecules, transporting materials, powering the motion of cilia or flagella, and contracting muscles to create movement.
A living cell’s primary tasks of obtaining, transforming, and using energy to do work may seem simple. However, the second law of thermodynamics explains why these tasks are harder than they appear. All energy transfers and transformations are never completely efficient. In every energy transfer, some amount of energy is lost in a form that is unusable. In most cases, this form is heat energy. When we say that energy is lost, we are not saying it disappears (this would violate the first law of thermodynamics). We are saying that is becomes unusable, usually because it become heat. For example, if I am riding my bike, I am transforming chemical energy from the food I ate into kinetic energy (energy of motion). This kinetic energy is usable and moves me from place to place or could move another object, for example, if I ran into a small trash can. If instead of running into the trash can, I braked hard and came to a quick stop, my kinetic energy would be transformed to heat. I could feel it if I touched my tires.
Thermodynamically, heat energy is defined as the energy transferred from one system to another that is not work. For example, when a light bulb is turned on, some of the energy being converted from electrical energy into light energy is lost as heat energy. Likewise, some energy is lost as heat energy during cellular metabolic reactions.
An important concept in physical systems is that of order and disorder. The more energy that is lost by a system to its surroundings, the less ordered and more random the system is. Scientists refer to the measure of randomness or disorder within a system as entropy. High entropy means high disorder and low energy. Molecules and chemical reactions have varying entropy as well. For example, entropy increases as molecules at a high concentration in one place diffuse and spread out. The second law of thermodynamics says that energy will always be lost as heat in energy transfers or transformations. Living things are highly ordered, requiring constant energy input to be maintained in a state of low entropy.
Cells run on the chemical energy found mainly in carbohydrate molecules, and the majority of these molecules are produced by one process: photosynthesis. Through photosynthesis, certain organisms convert solar energy (sunlight) into chemical energy, which is then used to build carbohydrate molecules. The energy stored in the bonds to hold these molecules together is released when an organism breaks down food. Cells then use this energy to perform work, such as movement. The energy that is harnessed from photosynthesis enters the ecosystems of our planet continuously and is transferred from one organism to another. Therefore, directly or indirectly, the process of photosynthesis provides most of the energy required by living things on Earth. Photosynthesis also results in the release of oxygen into the atmosphere. In short, to eat and breathe, humans depend almost entirely on the organisms that carry out photosynthesis.
Solar Dependence and Food Production
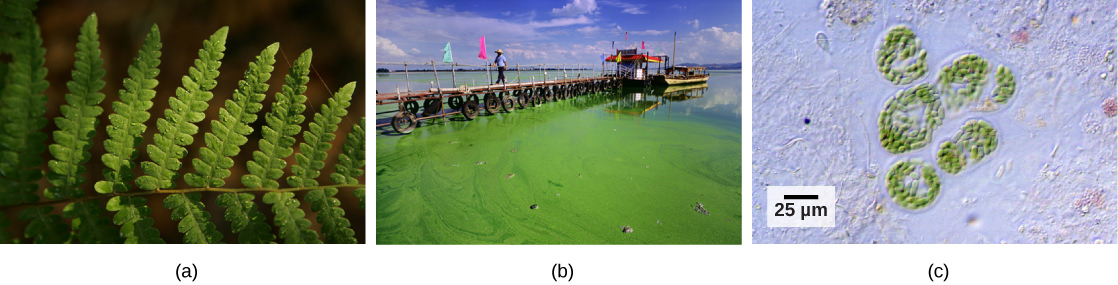
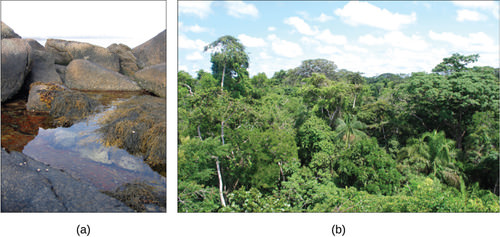
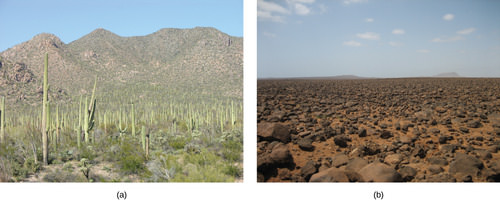
Some organisms can carry out photosynthesis, whereas others cannot. An autotroph is an organism that can produce its own food. The Greek roots of the word autotroph mean “self” (auto) “feeder” (troph). Plants are the best-known autotrophs, but others exist, including certain types of bacteria and algae (Figure 1). Oceanic algae contribute enormous quantities of food and oxygen to global food chains. More specifically, plants are photoautotrophs, a type of autotroph that uses sunlight and carbon from carbon dioxide to synthesize chemical energy in the form of carbohydrates. All organisms carrying out photosynthesis require sunlight. Chemoautotrophs are organisms that use inorganic molecules as an energy source. Chemoautotrophs are much less abundant than photoautotrophs and are often found in extreme environments such as near deep-seafloor hydrothermal vents.
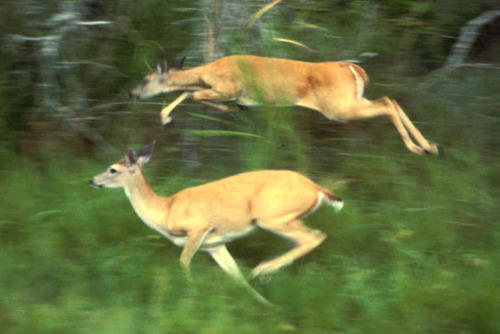
Heterotrophs are organisms incapable of photosynthesis that must therefore obtain energy and carbon from food by consuming other organisms. The Greek roots of the word heterotroph mean “other” (hetero) “feeder” (troph), meaning that their food comes from other organisms. Even if the organism being consumed is another animal, it traces its stored energy back to autotrophs and the process of photosynthesis. Humans are heterotrophs, as are all animals and fungi. Heterotrophs depend on autotrophs, either directly or indirectly. For example, a deer obtains energy by eating plants. A wolf eating a deer obtains energy that originally came from the plants eaten by that deer (Figure 2). Using this reasoning, all food eaten by humans can be traced back to autotrophs that carry out photosynthesis.
Summary of Photosynthesis
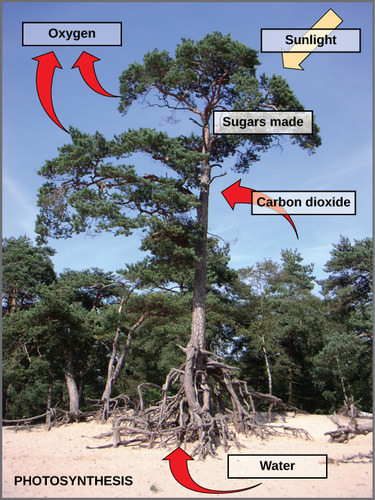
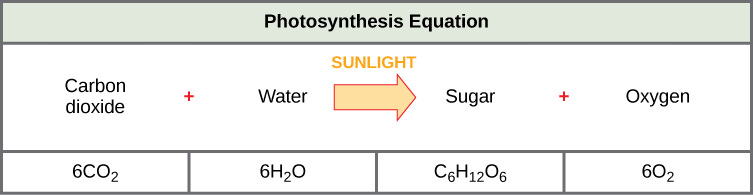
Photosynthesis requires sunlight, carbon dioxide, and water as starting reactants (Figure 3). After the process is complete, photosynthesis releases oxygen and produces carbohydrate molecules, most commonly glucose. These sugar molecules contain the energy that living things need to survive. The complex reactions of photosynthesis can be summarized by the chemical equation shown below. Although the equation looks simple, the many steps that take place during photosynthesis are actually quite complex. In plants, photosynthesis takes place primarily in the chloroplasts of leaves. Chloroplasts have a double (inner and outer) membrane. Within the chloroplast is a third membrane that forms stacked, disc-shaped structures called thylakoids. Embedded in the thylakoid membrane are molecules of chlorophyll, a pigment (a molecule that absorbs light) through which the entire process of photosynthesis begins.
The Two Parts of Photosynthesis
Photosynthesis takes place in two stages: the light-dependent reactions and the Calvin cycle. In the light-dependent reactions chlorophyll absorbs energy from sunlight and then converts it into chemical energy with the aid of water. The light-dependent reactions release oxygen as a byproduct from the splitting of water. In the Calvin cycle, the chemical energy derived from the light-dependent reactions drives both the capture of carbon in carbon dioxide molecules and the subsequent assembly of sugar molecules.
The Global Significance of Photosynthesis
The process of photosynthesis is crucially important to the biosphere for the following reasons:
- It creates O2, which is important for two reasons. The molecular oxygen in Earth’s atmosphere was created by photosynthetic organisms; without photosynthesis there would be no O2 to support cellular respiration needed by complex, multicellular life. Photosynthetic bacteria were likely the first organisms to perform photosynthesis, dating back 2-3 billion years ago. Thanks to their activity, and a diversity of present-day photosynthesizing organisms, Earth’s atmosphere is currently about 21% O2. Also, this O2 is vital for the creation of the ozone layer, which protects life from harmful ultraviolet radiation emitted by the sun. Ozone (O3) is created from the breakdown and reassembly of O2.
- It provides energy for nearly all ecosystems. By transforming light energy into chemical energy, photosynthesis provides the energy used by organisms, whether those organisms are plants, grasshoppers, wolves, or fungi. The only exceptions are found in very rare and isolated ecosystems, such as near deep sea hydrothermal vents where organisms get energy that originally came from minerals, not the sun.
- It provides the carbon needed for organic molecules. Organisms are primarily made of two things: water and organic molecules, the latter being carbon based. Through the process of carbon fixation, photosynthesis takes carbon from CO2 and converts it into sugars (which are organic). Carbon in these sugars can be re-purposed to create the other types of organic molecules that organisms need, such as lipids, proteins, and nucleic acids. For example, the carbon used to make your DNA was once CO2 used by photosynthetic organisms (see section 3.1 for more information on food webs).
Food Chains and Food Webs
A food chain is a linear sequence of organisms through which nutrients and energy pass as one organism eats another. The levels in the food chain are producers, primary consumers, higher-level consumers, and finally decomposers. These levels are used to describe ecosystem structure and dynamics. There is a single path through a food chain. Each organism in a food chain occupies a specific trophic level (energy level), its position in the food chain or food web.
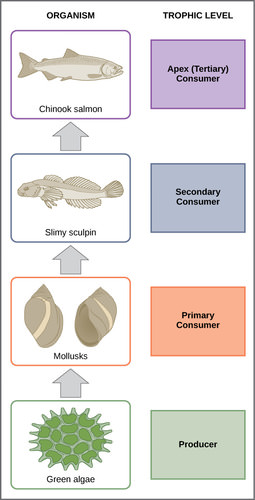
In many ecosystems, the base, or foundation, of the food chain consists of photosynthetic organisms (plants or phytoplankton), which are called producers. The organisms that consume the producers are herbivores called primary consumers. Secondary consumers are usually carnivores that eat the primary consumers. Tertiary consumers are carnivores that eat other carnivores. Higher-level consumers feed on the next lower trophic levels, and so on, up to the organisms at the top of the food chain. In the Lake Ontario food chain, shown in Figure 3, the Chinook salmon is the apex consumer at the top of this food chain.
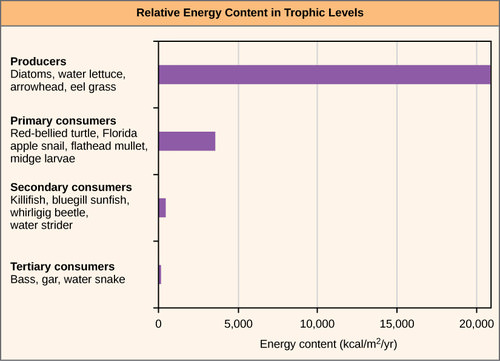
One major factor that limits the number of steps in a food chain is energy. Energy is lost at each trophic level and between trophic levels as heat and in the transfer to decomposers. The loss of energy between trophic levels is illustrated by the pioneering studies of Howard T. Odum in the Silver Springs, Florida, ecosystem in the 1940s. Some of the data from this study is shown below. The primary producers generated 20,819 kcal/m2/yr (kilocalories per square meter per year), the primary consumers generated 3368 kcal/m2/yr, the secondary consumers generated 383 kcal/m2/yr, and the tertiary consumers only generated 21 kcal/m2/yr. Thus, there is little energy remaining for another level of consumers in this ecosysem.
There is one problem when using food chains to describe most ecosystems. Even when all organisms are grouped into appropriate trophic levels, some of these organisms can feed at more than one trophic level. In addition, species feed on and are eaten by more than one species. In other words, the linear model of ecosystems, the food chain, is a hypothetical and overly simplistic representation of ecosystem structure. A holistic model—which includes all the interactions between different species and their complex interconnected relationships with each other and with the environment—is a more accurate and descriptive model for ecosystems. A food web is a concept that accounts for the multiple trophic (feeding) interactions between each species (Figure 5 below).
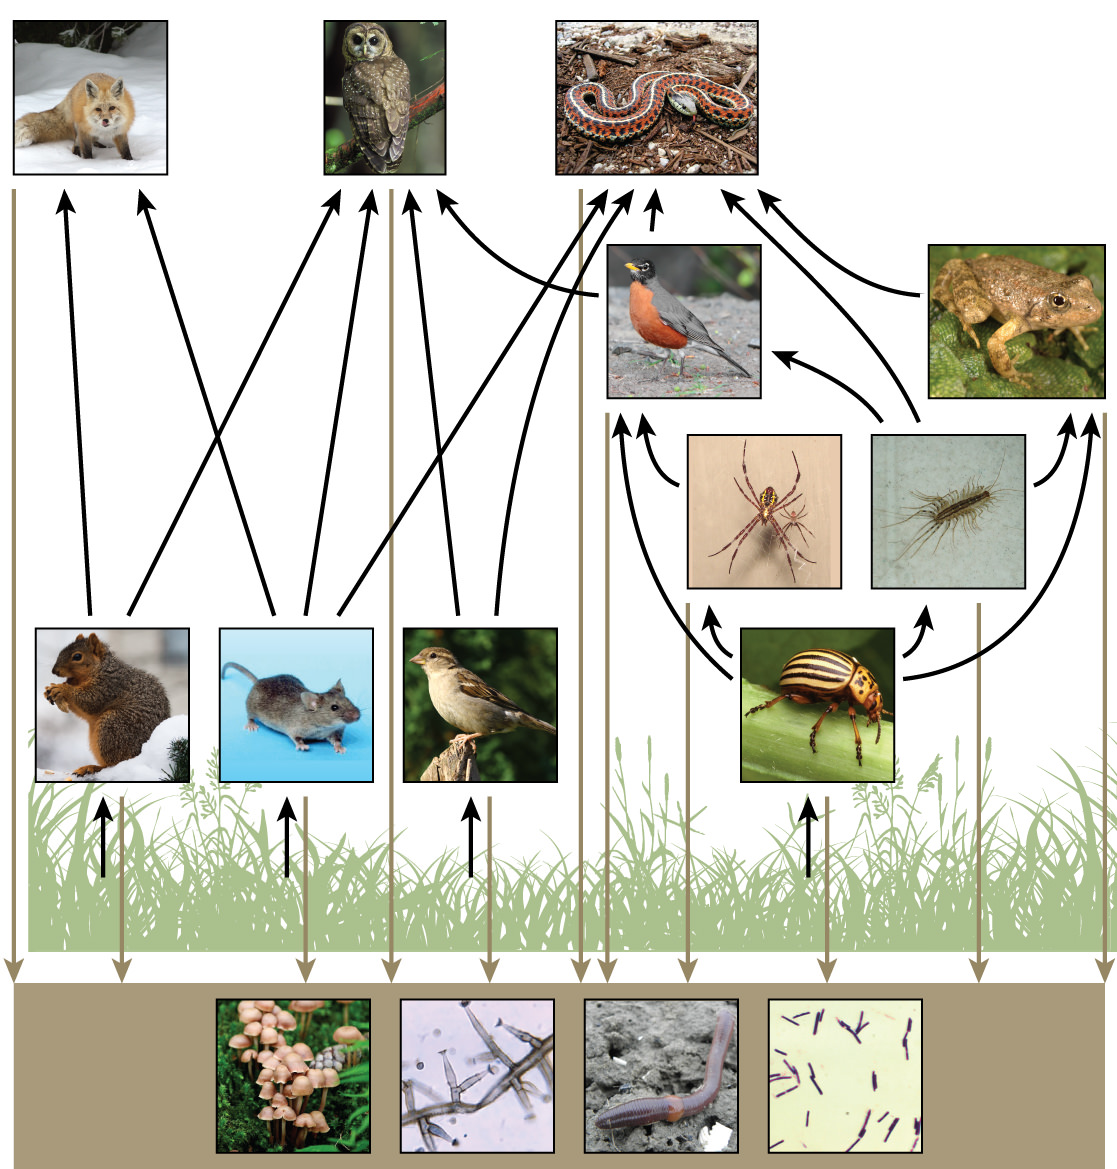
Two general types of food webs are often shown interacting within a single ecosystem. A grazing food web has plants or other photosynthetic organisms at its base, followed by herbivores and various carnivores. A detrital food web consists of a base of organisms that feed on decaying organic matter (dead organisms), including decomposers (which break down dead and decaying organisms) and detritivores (which consume organic detritus). These organisms are usually bacteria, fungi, and invertebrate animals that recycle organic material back into the biotic part of the ecosystem as they themselves are consumed by other organisms.
Productivity within Trophic Levels
Productivity within an ecosystem can be defined as the percentage of energy entering the ecosystem incorporated into biomass in a particular trophic level. Biomass is the total mass, in a unit area at the time of measurement, of living or previously living organisms within a trophic level. Ecosystems have characteristic amounts of biomass at each trophic level. For example, in the English Channel ecosystem the primary producers account for a biomass of 4 g/m2 (grams per meter squared), while the primary consumers exhibit a biomass of 21 g/m2.
Because all organisms need to use some of this energy for their own functions (like respiration and resulting metabolic heat loss) scientists often refer to the net primary productivity of an ecosystem. Net primary productivity is the energy that remains in the primary producers after accounting for the organisms’ respiration and heat loss. The net productivity is then available to the primary consumers at the next trophic level. In our Silver Spring example, 13,187 of the 20,810 kcal/m2/yr were used for respiration or were lost as heat, leaving 7,632 kcal/m2/yr of energy for use by the primary consumers.
Primary productivity provides energy to the ecosystem
Gross primary productivity is the rate at which solar or chemical energy is captured and converted into chemical bonds by producers in an area. Producers use energy for their own respiration, growth, and reproduction.When energy that is assimilated by producers and converted into producer biomass in an area is called net primary productivity (NPP). NPP includes all energy that is not respired.
NPP = GPP – Respiration (Both GPP and NPP are expressed in units of Joules (J) / m2 / year.)
However, photosynthesis is not a very efficient process. Only 1% of solar energy is captured and used by photosynthesis, which is gross primary productivity
Secondary production
Herbivores consume only a fraction of the total producer biomass available. They can only digest a portion of the energy they consume. Secondary production is the amount of assimilated energy converted into new biomass (growth and reproduction) by herbivores.
The image below shows that a rabbit consumes on the cabbage (primary production provied by the producers), a process we called consumption. A small protion of consumed energy that is excreted or regurgitated is the egested energy. The portion of consumed energy that the rabbit digests and absorbs is called assimilated energy (assimilation; analogous to GPP for producers). The rabbit uses a portion of assimilated energy for respiration, which is called respirated energy. The remaining assimilated energy can be used for growth and reproduction, which is called net secondary productivity.

This diagram shows a rabbit (primary consumer) consumes the cabbage (producer). The consumed energy is either excreted as waste (egested energy; non-assimilated energy) or converted into assimilated energy (including respired energy and biomass- secondary productivity) (Diagram created by Dr. Ching-Yu Huang, Biology instructor, Virginia Commonwealth University, VA by adapting images: Rabbit, Openclipart. CC0 Public Domain and Cabbage, Openclipart. CC0 Public Domain)
The efficiency of energy transfers within organisms
1.Consumption efficiency is the percentage of energy (J for joules) or biomass in a trophic level that is consumed by the next higher trophic level.

Primary productivity is the energy content in producers that is available to the organisms of the next trophic level (which is primary consumers; herbivores). Secondary productivity is the availble evergy content in the primary consumer to the next tropic level (i.e. secondary consumer, carnivores). You will use primary productivity as “Net production energy of the next lower trophic level” in the equation above, when you are calculating the consumption efficiency for primary consumer. And you will use secondary productivity as “Net production energy of the next lower trophic level” in the equation above, when you are calculating the consumption efficiency for seconary consumer.
2. The percentage of consumed energy by an organims that is assimilated in the body of the consumer (i.e., material that is not egested) is called assimilation efficiency. It is calculated based on the amount of assimialted energy divided by the consumed energy.

Assimilation efficiency varies among trophic levels. Primary consumers (i.e. herbivores) tend to have lower efficiencies than secondary consumers because animal tissues are more digestible than plant tissues (contain many undigestible materials, such as fibers and lignin).
3. Net production efficiency is the percentage of assimilated energy that is used for growth and reproduction. You may also consider that net production efficiency is the percentage of assimilated energy that remains after an organism’ respiration.

Net production efficiency (NPE) allows ecologists to quantify how efficiently organisms of a particular trophic level incorporate the energy they receive into biomass. Thus, net production efficiency measures how efficiently each trophic level uses and incorporates the energy from its food into biomass to fuel the next trophic level.
For active homeothermic animals, they spend significant amount of energy to maintain body temperature, move, circulate blood, and osmoregulate, so their net production efficiency can be as low as 1%. In general, cold-blooded animals (ectotherms), such as invertebrates, fish, amphibians, and reptiles, use less of the energy they obtain for respiration and heat than warm-blooded animals (endotherms), such as birds and mammals. The extra heat generated in endotherms, although an advantage in terms of the activity of these organisms in colder environments, is a major disadvantage in terms of net production efficiency. Therefore, many endotherms have to eat more often than ectotherms to get the energy they need for survival. In general, NPE for ectotherms is an order of magnitude (10x) higher than for endotherms. For example, the NPE for a caterpillar eating leaves has been measured at 18 percent, whereas the NPE for a squirrel eating acorns may be as low as 1.6 percent.
The inefficiency of energy use by warm-blooded animals has broad implications for the world’s food supply. It is widely accepted that the meat industry uses large amounts of crops to feed livestock, and because the NPE is low, much of the energy from animal feed is lost. For example, it costs about 1¢ to produce 1000 dietary calories (kcal) of corn or soybeans, but approximately $0.19 to produce a similar number of calories growing cattle for beef consumption. The same energy content of milk from cattle is also costly, at approximately $0.16 per 1000 kcal. Much of this difference is due to the low NPE of cattle. Thus, there has been a growing movement worldwide to promote the consumption of non-meat and non-dairy foods so that less energy is wasted feeding animals for the meat industry.
Ecological Efficiency: The Transfer of Energy between Trophic Levels
As illustrated in Silver Springs ecosystem, large amounts of energy are lost from the ecosystem from one trophic level to the next level as energy flows from the primary producers through the various trophic levels of consumers and decomposers. The main reason for this loss is the second law of thermodynamics, which states that whenever energy is converted from one form to another, there is a tendency toward disorder (entropy) in the system. In biologic systems, this means a great deal of energy is lost as metabolic heat when the organisms from one trophic level consume the next level. In the Silver Springs ecosystem example, we see that the primary consumers produced 1103 kcal/m2/yr from the 7618 kcal/m2/yr of energy available to them from the primary producers. The measurement of energy transfer efficiency between two successive trophic levels is termed the ecological efficiency and is defined by the formula:
Ecological efficiency (also called food chain efficiency) is the percentage of net production from one trophic level compared to the next lower trophic level.

Ecological efficiency incorporates consumption, assimilation, and net production efficiency. Because energy is lost at each of these processes, ecological efficiency is usually low, ranging from 5% to 20%. However, 10% is used as a rule of thumb.
For example, in Silver Springs, the ecological efficiency between the first two trophic levels was approximately 14.8 percent. The low efficiency of energy transfer between trophic levels is usually the major factor that limits the length of food chains observed in a food web. The fact is, after four to six energy transfers, there is not enough energy left to support another trophic level. In the Lake Ontario example, only three energy transfers occurred between the primary producer, (green algae), and the apex consumer (Chinook salmon).
Ecologists have many different methods of measuring energy transfers within ecosystems. Some transfers are easier or more difficult to measure depending on the complexity of the ecosystem and how much access scientists have to observe the ecosystem. In other words, some ecosystems are more difficult to study than others, and sometimes the quantification of energy transfers has to be estimated.
Modeling Energy Flow: Ecological Pyramids
The structure of ecosystems can be visualized with ecological pyramids, which were first described by the pioneering studies of Charles Elton in the 1920s. Ecological pyramids show the relative amounts of various parameters (such as number of organisms, energy, and biomass) across trophic levels.
Pyramids of numbers can be either upright or inverted, depending on the ecosystem. As shown at the bottom of this section, a typical grassland during the summer has a base of many plants and the numbers of organisms decrease at each trophic level. However, during the summer in a temperate forest, the base of the pyramid consists of few trees compared with the number of primary consumers, mostly insects. Because trees are large, they have great photosynthetic capability, and dominate other plants in this ecosystem to obtain sunlight. Even in smaller numbers, primary producers in forests are still capable of supporting other trophic levels.
Another way to visualize ecosystem structure is with pyramids of biomass. This pyramid measures the amount of energy converted into living tissue at the different trophic levels. Using the Silver Springs ecosystem example, this data exhibits an upright biomass pyramid, whereas the pyramid from the English Channel example is inverted. The plants (primary producers) of the Silver Springs ecosystem make up a large percentage of the biomass found there. However, the phytoplankton in the English Channel example make up less biomass than the primary consumers, the zooplankton. These two pyramids are included in the figure at the end of this section. As with inverted pyramids of numbers, this inverted pyramid is not due to a lack of productivity from the primary producers, but results from the high turnover rate of the phytoplankton. The phytoplankton are consumed rapidly by the primary consumers, thus, minimizing their biomass at any particular point in time. However, phytoplankton reproduce quickly, thus they are able to support the rest of the ecosystem.
Pyramid ecosystem modeling can also be used to show energy flow through the trophic levels. Notice that these numbers are the same as those used in the energy flow compartment diagrams. Pyramids of energy are always upright, and an ecosystem without sufficient primary productivity cannot be supported. All types of ecological pyramids are useful for characterizing ecosystem structure. However, in the study of energy flow through the ecosystem, pyramids of energy are the most consistent and representative models of ecosystem structure.

Ecological pyramids depict the (a) biomass, (b) number of organisms, and (c) energy in each trophic level in aquatic (Silver Spring and English Channel ecosystems) and terrestrial ecosystems (grassland and temperate forest).
Consequences of Food Webs: Biological Magnification
One of the most important consequences of ecosystem dynamics in terms of human impact is biomagnification. Biomagnification is the increasing concentration of persistent, toxic substances in organisms at each successive trophic level. These are substances that are lipid soluble and are stored in the fat reserves of each organism. Many substances have been shown to biomagnify, including classical studies with the pesticide dichlorodiphenyltrichloroethane (DDT), which were described in the 1960s bestseller Silent Spring by Rachel Carson. DDT was a commonly used pesticide before its dangers to apex consumers, such as the bald eagle, became known. DDT and other toxins are taken in by producers and passed on to successive levels of consumers at increasingly higher rates. As bald eagles feed on contaminated fish, their DDT levels rise. It was discovered that DDT caused the eggshells of birds to become fragile, which contributed to the bald eagle being listed as an endangered species under U.S. law. The use of DDT was banned in the United States in the 1970s.
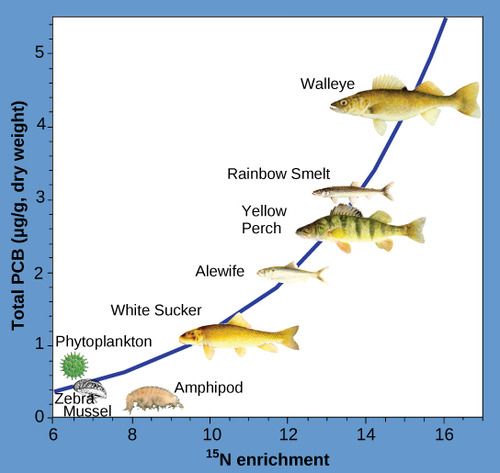
Another substances that biomagnifies is polychlorinated biphenyl (PCB), which was used as coolant liquids in the United States until its use was banned in 1979. PCB was best studied in aquatic ecosystems where predatory fish species accumulated very high concentrations of the toxin that is otherwise exists at low concentrations in the environment. As illustrated in a study performed by the NOAA in the Saginaw Bay of Lake Huron of the North American Great Lakes (Figure 7 below), PCB concentrations increased from the producers of the ecosystem (phytoplankton) through the different trophic levels of fish species. The apex consumer, the walleye, has more than four times the amount of PCBs compared to phytoplankton. Also, research found that birds that eat these fish may have PCB levels that are at least ten times higher than those found in the lake fish.
Other concerns have been raised by the biomagnification of heavy metals, such as mercury and cadmium, in certain types of seafood. The United States Environmental Protection Agency recommends that pregnant women and young children should not consume any swordfish, shark, king mackerel, or tilefish because of their high mercury content. These individuals are advised to eat fish low in mercury: salmon, shrimp, pollock, and catfish. Biomagnification is a good example of how ecosystem dynamics can affect our everyday lives, even influencing the food we eat.
Consequences of Food Webs: Trophic Cascades
The interdependence of organisms in an ecosystem through the food webs means that changes to one type of organism can affect other organisms. For example, in the example of the Silver Springs ecosystem, if one of the primary producers, such as the eelgrass, died off in the area, the primary consumers would eat more of the other primary producers, decrease in abundance due to lack of food or some combination of the two. What is less obvious is that a change in one trophic level (such as a secondary consumer) may have indirect effects on a non-adjacent trophic level (such as primary producers). This is called a trophic cascade. One classic example of the importance of trophic cascades is seen in the ecological role of wolves in Yellowstone National Park. Watch the video below to learn more.
The impact of the wolves in Yellowstone Park on lower trophic levels is an example of top-down control, the higher trophic level has impacts on multiple lower trophic levels. This type of control was originally thought to be fairly rare, but may be more common than we think. Some systems exhibit bottom-up control in which the primary producers control the abundance at the upper trophic levels. In these instances, the growth of the primary producers is typically limited by some resource, such as nutrient or water, and increasing the amount of that resource would increase the biomass of the primary producer and the upper trophic levels.
Suggested Supplementary Reading
Canales, M. et al. 2018. 6 Things that Make Like on Earth Possible [Infographic]. National Geographic. March.
Attribution
Foundational content was derived from the following sources.
Essentials of Environmental Science by Kamala Doršner is licensed under CC BY 4.0. Modified from the original by Matthew R. Fisher in Environmental Biology.
Energy Flow through Ecosystems by OpenStax is licensed under CC BY 3.0. Modified from the original by Matthew R. Fisher in Environmental Biology.
Introduction to Ecology (Open Course) by Huang, Ching-Yu; Crook-Hill, Janice; Darracq, Andrea; Collantes, Hugo; Wilkison, James; Aganovic, Enes; and Bell, Terri, (2018). Biological Sciences Ancillary Materials. 7. licensed under a Creative Commons Attribution-Noncommercial 4.0 License
