
Unit 2 (Empiricism) Supplement: Quantitative, Qualitative, and Mixed-Methods
Rose M. Spielman; Kathryn Dumper; William Jenkins; Arlene Lacombe; Marilyn Lovett; Marion Perlmutter; Alison Heinhold Melley; and Irene Feng
Experimental Research Studies
If researchers want to be able to claim a cause and effect about their variables – they need to do an experimental study. The Mueller and Oppenheimer (2014) study is an example of such a study. Because these researchers manipulated the conditions by assigning students to computer or hand notes, they can make some causal claims about note-taking and test scores. Keep in mind, however, that any claim made about an experiment might not be generalizable to other contexts, meaning we can’t be sure how far we can take a causal claim from one context and apply it to another.
In order to assess whether you understand the note-taking study (or any other research), you should ask yourself the following:
- What was the question being addressed by the investigator(s)?
- How did the procedures enable the question to be addressed?
- What were the results and conclusions regarding the question?
This research study used the scientific method. It was systematic and it asked an empirical question – Does the method of note-taking play a role in retention of lecture content? You can ask many different kinds of questions with experiments, but they all have the same basic design features. Let’s take a look at the features. Firstly, researchers always systematically change one variable, and then measure the impact of those changes on another variable. A variable is just something we can vary or measure in some way. The variable that is under the experimenters’ control is called the independent variable. In the case of the Study 1 of the note-taking experiments, the independent variable was the note-taking method. There were two conditions (options) – handwriting and laptop. The researchers (not the participants) decide on the options. This is what we mean by manipulating a variable. Experiments investigate whether the independent variable causes a change in the dependent variable. In this example, the participants’ learning is the dependent variable, because it depends on how the they took their notes (independent variable). The independent variable is often thought of as the “cause” and the dependent variable – “the effect” (see Figure 3.2). Mueller and Oppenheimer were able to conclude that group differences in learning were caused by how they took their notes.

Did the results of the note-taking study surprise you at first? If they did, you might have felt a little skeptical about it before reading the further analyses. You might have thought, “Doesn’t learning depend on a lot of different factors—including a person’s attention and desire to learn, time spent studying, their prior knowledge, or life circumstances? What if some people were bored by the lectures and didn’t pay attention? Wouldn’t people who are having a bad day perform worse on the quizzes? You are absolutely right and you are thinking like a psychologist! All of these factors (and many more) can easily affect a person’s performance on quiz questions. So, how can we take all of these different variables into account? A second feature of experiments that helps to compensate for these individual differences across people, is that they all use random assignment. In other words, participants cannot pick which group they are in, the experimenter assigns them to a particular condition or group randomly. This might be based on the flip of a coin, the roll of a die, or the generation of a random number by a computer. Random assignment makes it so the groups are relatively similar on all characteristics, except the one that the experimenter wants to manipulate. In Mueller and Oppenheimer’s study, there should be equal numbers of people with strong attention skills and equal numbers of people who were having a bad day in each group.
The researchers manipulated whether or not students took notes using their computer or by hand (independent variables) and measured the outcome (dependent variable). Another aspect of experiments is that the dependent variable must be quantifiable, in other words, it must be measurable in some way using numbers. In the note-taking experiments the researchers gave students a 40-question quiz to measure their retention of the lecture material. Then, they compared scores on the quiz among the note-taking groups (conditions) using statistics.
(insert better graph here)
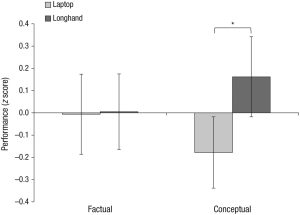
Psychologists use statistics in quantitative studies to assess whether group differences in the dependent variable are meaningful and reliable, or merely due to chance. In experimental research, there is a tremendous amount of control over the variables of interest. This is a powerful approach. However, psychology experiments are often conducted in artificial settings, like labs, and complex phenomena are reduced to simple numbers. It is sometimes difficult to know whether experimental findings would apply in real-world settings. This is one of the reasons why it is important that psychology as a discipline includes multiple types of research methods to build knowledge about the mind and behavior.
Quasi-Experimental Designs
Keeping with the note-taking study for just a bit longer, how could the effect be tested in a more real-world setting? If you said “test it in a real classroom” you’re thinking like a psychologist again! If this study was done, the researchers *could* manipulate note-taking by randomly assigning students in a classroom to note-taking conditions (and thus design a true experiment), but as soon as they did that they would remove some of “reality” because students typically choose their own method of note-taking. If they simply asked or observed which method students use, and then gave the quiz, they would not use random assignment for their pen or laptop groups.
Here’s the part that tends to get confusing: although the researcher is not using random assignment, there IS an independent variable. We not longer think of it as being “manipulated” or “controlled” but as the variable that groups are assigned on. So instead of using random assignment to divide up the note-taking groups, we use the independent variable grouping that already exists to create the groups. The research design still has an independent variable (note-taking method), and a dependent variable (learning). The study design used here is known as a quasi-experiment.
Let’s look at another example to illustrate quasi-experiment. Imagine a professor teaches two class sections of the same course: one in the morning and one in the afternoon. You want to know whether students in the morning earn the same grades as those in the afternoon. To judge this, you’re going to look at the final grades in each section. Letter grades can easily be turned into numbers (for quantitative research). Here, the independent variable is the class time and the dependent variable is the students’ grades. In an experimental design, you would randomly assign students to one of the two class sections and then compare the students’ final grades. However, in real life, researchers can’t randomly force students to take one class over another. Instead, the researchers would just have to study the classes as they stand (quasi-experimental design). Students’ choice of class rime may seem random, but it’s most likely not. Some students know that they learn better at certain times of day, or their other courses determine their availability. Maybe the morning class is very early (like 8:00 am) which most college students do not like. But, since some schools allow Honors students (who typically have better grades than other students) to register first, the afternoon class could have more honors students than the morning class and this might affect the average grades in the class. So, even though a quasi-experimental design is similar to an experimental design (i.e., it has independent and dependent variables), because there’s no random assignment you cannot reasonably draw the same conclusions that you would with an experimental design. However, quasi-experiments are still very useful in providing information about different groups of people, based on various aspects of their identity, or their demographics.
NON-Experimental Designs
While every study psychologists do can inform us about how people act, behave, or think, not every study can make the same types of claims. This goes back to the study design itself. The way psychologists design different studies means we can draw different conclusions.
Although experimental designs are the most reliable and powerful method for determining cause and effect, it is not always possible to manipulate variables in psychology (or other sciences, for that matter). For example, one cannot “make” someone male or female, or a particular age, etc. We can only select subjects already possessing the different attributes. We do not have the power to manipulate geographic or climatic variables to see the extent to which they influence behavior. Many variables cannot be manipulated for ethical reasons. For example, we cannot systematically punish children severely to see if that is an effective technique for eliminating undesirable behavior. Indeed, some have even questioned studying the effect of punishment on the dangerously self-destructive acts of autistic children (Bettelheim, 1985). For these reasons, many in the other laboratory sciences describe psychology as “soft.” Sometimes they even question the possibility of conducting psychology as a science. The research findings described in this book attest to the fruitfulness of applying the scientific method to psychological questions. The discipline of psychology frequently applies non-experimental designs under conditions where experimental procedures are logistically impossible, prohibitive in cost, or unethical.
Correlational Design
With correlational studies, we can examine the relationship between two variables. We only observe what is happening, we don’t change anything. For example, a study that looked at the relationship between education level and income would be correlational. We cannot attribute a causal effect because we do not manipulate either of these variables.! In a correlational study, we only measure variables, not the effects of variables on other variables. We might be able to say that higher education is related to higher income, and we can say how strong that relationship is, but we cannot say that one causes the other. There is no way to randomly assign people to education levels and design an experiment. A quasi-experiment is only possible with advanced statistics, because we could not control any conditions around geographic location, job, family, quality of education, mental health, and so much more that could be involved in the relationship between education and income. Because there are so many variables unaccounted for, they could potentially influence our results and could be the reason why we see the relationship.
In correlational research, scientists do not intervene and measure changes in behavior. Instead, they passively observe and measure variables and identify patterns of relationships between them. For example, the graph below show’s a study on donations and happiness (Dunn et all 2008). Dr. Dunn’s team asked participants how much of their income they donated to charity in the past month; she later asked them how happy they were (using a 5-point scale). Then they looked at the relationship between the two variables. Dunn found that the more donations people made to charity; the happier they reported feeling.
How do we “look at the relationship between two variables?” This is a statistic called a correlation coefficient – it tells us about how strong the relationship and which direction it goes in. First, we create a scatterplot (see Figure 4.6). In the scatterplot, each dot represents a person in the study and their happiness level and donation amount. We call this a data point.
. Noba Project.")
We have added a best fit (dotted) line through the data in Figure 4.6, the line represents the average relationship between the two variables. It has equal numbers of points above and below it. The correlation coefficient (abbreviated as r) is calculated from the data points. The sign of r (positive or negative) indicates the direction of correlation. In Figure 4.6, the line slopes upwards, therefore, r is a positive number (+0.81) indicating that the data show a positive correlation. In other words, the variables move in the same direction – as one goes up so does the other. Low donations correlate with low happiness, and high donations with high happiness ratings.
. Noba Project.")
Figure 4.7 shows the data from a different research study. We see the relationship between average height of men in different countries on the y-axis and the prevalence of a pathogen (something that causes disease) in each country on the x-axis. Each dot represents a different country. The line of best fit slopes downwards because there is a negative correlation between the two variables. We can see that countries with taller men have lower incidence of the pathogen and vice versa. In other words, as one variable (height) goes up, the other one (pathogen prevalence) goes down. In Figure 4.7, the correlation coefficient (r = -0.83) is a negative number.
The strength of a correlation tells us about the closeness of the relationship between the two variables. If all the points sat on the best fit lines, this would be the very strong relationship and r would be 1 or -1 (depending on the direction of the association). The higher the absolute value of r (ignore the +/- sign), the stronger the relationship. Perhaps you can see that the dots are a little closer to the line in Figure 4.7 compared to Figure 4.6? This is because the absolute value of r is slightly larger ( a stronger correlation) for Figure 4.7 (-0.83) compared to Figure 4.6 (+0.81). The relationship between variables can vary from strong to weak. Sometimes, r is so low (close to zero), that we say there is no correlation, or the variables are uncorrelated, and the best fit line would be horizontal or flat.
Correlation is NOT causation
Correlational studies like the ones we see in Figures 4.6 and 4.7are very useful for making predictions about the relationships between two variables. They are usually cheaper and less time-consuming to run than experiments and often serve as a start to a more rigorous design that can investigate the causes.
Frequently non-experimental studies can provide information about the relationship between variables despite not being able to demonstrate cause and effect. However, even when relationships between variables are compelling, for example when a substantial statistical correlation exists, it is still not possible to conclude cause and effect. Often there is a hidden third variable (or more) underlying the correlation. For example, it is likely there is a high correlation between the number of books in one’s home and success in school. That does not mean that by simply providing books to an individual it will improve school performance. It is likely the number of books in one’s home is indicative of a number of economic and attitudinal advantages. Still, the fact that this correlation exists is informative and could lead to an experiment to test whether there is a cause and effect relationship between the number of books and school performance.
Summary:
Although we cannot say anything definitive about WHY the relationship exists, correlational studies still can be useful for understanding the strength and direction of the relationship between two constructs of interest. We can claim that two variables are related, or correlated, and the correlation coefficient (r) gives us information about how strong the relationship is and in which direction (i.e. whether the variables increase and decrease together, or whether as one increases, the other decreases in value. )
Qualitative Research
There are pros and cons to all of the various types of research design in Psychology. We have already seen that experiments allow us to study cause and effect. However, correlational and quasi-experimental research also have value, because they allow us to study topics we cannot experimentally manipulate (these might include whether people have a large or small income; whether they identify as male, female, non-binary, trans, etc.). However, quantitative methods often reduce complex psychological phenomena to simple processes studied in artificial settings and so it is sometimes difficult to reconcile this with how people behave, think, and feel in real world settings. Qualitative research offers the potential for researchers to contextualize their findings within a broader social, cultural, and historical context, and is gaining more popularity as an alternative methodology in the field of psychology. While quantitative research focuses on generating specific answers to research questions using numbers and statistics, qualitative research aims to provide detailed descriptions of human behavior that help to understand the personal experiences of the research participants.

Qualitative research is not hypothesis driven, and questions tend to be more general, with the goal of understanding what people feel or understand about certain situations in their lives. For example, counseling psychologist, Dr. Aisha Holder and colleagues wanted to understand how successful Black women in senior management positions in corporate America experienced and coped with racism in the work place. They wanted to provide rich, detailed, and contextualized descriptions and so they conducted a qualitative research study where they asked ten participants about their lived experiences (Holder et al. 2015).
Methods of Data Collection
The ways that psychological data is collected varies a lot across studies, and methods used in qualitative studies sometimes overlap with those used in quantitative studies (interviews, archival data, and surveys). However, the data generated in qualitative studies are more complex, because they do not need to be represented by numerical values. Thus, questions are typically more open-ended. For example, in her qualitative research study, psychologist, Luo Lu from Taiwan asked Chinese students to write an essay in response to the prompt: What is happiness? (Lu, 2008). As you can imagine, this generates a lot more data than simply asking people to rate how happy they feel on a numerical scale (Dunn et al., 2008). Qualitative studies are also inherently flexible in their design, researchers frequently adapt their methods and questions in response to new findings as they emerge in the study.
Interviews
One of the most common ways to gather data in qualitative psychological research is to conduct interviews. Interviews vary in their format; they can be unstructured, structured, or semi-structured. Unstructured interviews consist of asking a few, very broad questions and letting the participants talk as much as possible. In structured interviews, the researchers have a list of questions that they ask in a systematic fashion. Most interviews in qualitative research are semi-structured, which is somewhere in between the two other types of interview. The researcher has a list of scripted questions, but they can ask other follow-up questions about the topics that participants bring up. Dr. Holder and her colleagues used semi-structured interviews in their study of successful business women and their experiences of racism (Holder et al., 2015).
Interviews in qualitative psychology studies are often lengthy and generate a lot of information, researchers frequently record the interviews (with the participants’ permission) and/or make detailed notes on what everyone said. Recordings are later transcribed into text. The researcher might also observe non-verbal cues and behaviors during the interviews, such as changes in tone of voice or body language. As you can imagine, it is very time consuming to collect and analyze interview data and so the total number of participants in a qualitative study using interviews is typically small. Dr. Holder’s research study had 10 participants, but in some studies, there are even fewer. Interviews can be conducted in private with a single individual; but focus groups (where small groups of people are interviewed together) are also popular.

In focus groups, participants interact with each other and share ideas, which can often make them feel more at ease and open. This can help to generate richer, more comprehensive responses. Consumer psychologists often use focus groups to understand people’s reactions to new products and how they might influence their buying behaviors. However, focus groups may be less appropriate for sensitive topics. In Dr. Holder’s study about racism in the workplace, she conducted individual interviews to ensure that participants had an increased feeling of privacy and anonymity. Sometimes, researchers conduct both individual interviews and focus groups and compare people’s responses in the two settings. As you know (and will learn more about in the modules on Social Psychology), people often behave differently in groups compared to when they are alone. For example, in their ethnographic study on the views of poor and working class Gen-Xers from various racial backgrounds, Fine and Weis found that White women only reported being victims of domestic violence in individual interviews but not in focus groups (Fine & Weis, 1998).
Observational Data Collection
Data about behavior can also be collected by observation—watching and recording how people (or animals) behave in natural settings in their everyday lives—this type of research is often referred to as field research. This differentiates between studies where researchers collect data in a research lab. Observations in field settings can occur in one of two ways. During naturalistic observation, the researchers try to be as unobtrusive as possible, and collect data without influencing the situation. For example, researchers might be interested in learning more about the dynamics of bullying and peer relationships in young children. They want to observe how young children play together in a pre-school setting, but they don’t want to change the dynamics of the group by sitting in the same room as the children. The researchers might set up an adjoining room with a two-way mirror, so that they can see and record the children’s behavior, but the children cannot see or hear them. Alternatively, a researcher may use participant observation, where they become a participant in the culture or context they are observing. For example, in 1973, psychologist, David Rosenhan conducted a qualitative research study where he and a few others went to psychiatric institutions and pretended to be mentally ill. They told the doctors that they had been hearing voices. After they were admitted as patients, they then recorded their experiences of the ward, patients, and staff in their notebooks (Rosenhan, 1973). Once admitted they told staff that they no longer heard voices, and behaved normally. However, their behavior was often interpreted by staff in the context of their diagnosis of schizophrenia.
Other forms of qualitative data collection
Psychological data can also be collected using surveys. In qualitative research, the questions are open-ended, for example, “What makes you happy? “ allowing for extensive, individualized responses. Surveys are also used in quantitative research, but they consist of closed-ended questions that can be coded numerically (like the rating scale that Dr. Dunn’s team used to ask people “How happy do you feel?”). Psychologists may also use archival data in both qualitative or quantitative studies. Archival data are records of people’s lives that were collected by other entities, for other purposes. They can include public health records, census and other population data, records of births, deaths, and marriages, medical and police records, real estate transactions, newspaper stories, films, videos, art work, music, and personal items, such as letters, diaries, emails, and social media. For example, Sanger and Veach (2008) conducted an archival study where they analyzed suicide notes to try and understand more about social interactions among people who commit suicide.
Data Analysis in Qualitative Studies
As you have already seen, the ways that data in qualitative and quantitative studies are collected is often somewhat similar (surveys, interviews, archives, observation). However, it is the way that data are analyzed and reported that really sets the two approaches apart. For example, researchers using qualitative techniques are acutely aware of their influence on the research process and often disclose positionality and identity as part of their research article. There are many different ways to analyze qualitative data. Researchers frequently use a coding system to look for recurring patterns and often provide rich and detailed descriptions of their participants’ behavior in real-world contexts. This might include quotes from participants, as well as descriptions of their feelings and actions. This is often referred to as “thick description” (Geertz, 1973). Some qualitative studies use the phenomenological approach, which aims to richly portray their participants lived experiences using thick descriptions, moreover, it does not try to explain why people behave the way they do. Dr. Holder’s study of Black women managers employed a phenomenological approach where they used thick descriptions to convey their participants’ experiences of racism in the workplace and the many different ways that they coped with it.
Grounded Theory
Another approach in qualitative research analysis is called grounded theory; researchers collect data and then develop a theory or an interpretation that is based on, or “grounded in” those data (Glaser & Strauss, 1967). First, the researchers identify ideas that are repeated throughout the data. They then organize these ideas into a smaller number of broader themes. Finally, they interpret the data by writing a theoretical narrative of these themes. This narrative focuses on the subjective experience of the participants and is usually supported by quotes. For example, Yosso and colleagues interviewed Latinx students attending three elite predominantly White academic higher education institutions about their academic aspirations, perceptions of campus climate, experiences of racism and coping mechanisms. They found that Latinx students experienced a good deal of racism on campus, which organized into three main types: racial jokes, interpersonal microaggressions (being excluded or insulted by White students), and institutional microaggressions (lack of representation among faculty and staff and no institutional support for Latinx students). Another theme was that Latinx students felt empowered to deal with the negative environment by banding together and supporting each other. The researchers interpreted their data within the context of critical race theory, which posits that racism is embedded systemically within society and institutions, like universities (Yosso et al., 2009).
Mixed Methods and Triangulation
Given their differences, it may come as no surprise that quantitative and qualitative research in psychology and related fields do not coexist in complete harmony. Some quantitative researchers criticize qualitative methods on the grounds that they lack objectivity, are difficult to evaluate in terms of reliability and validity, and do not allow generalization to people or situations other than those actually studied. At the same time, some qualitative researchers criticize quantitative methods on the grounds that they overlook the richness of human behavior and experiences and instead answer simple questions about easily quantifiable variables.
Some researchers agree that quantitative and qualitative approaches can and should be combined into what has come to be called mixed-methods research (Todd et al., 2004). One approach is to conduct a qualitative study first and then use the results for hypothesis generation and testing in a follow-up quantitative study. A second approach for combining quantitative and qualitative research is called triangulation, where researchers use both quantitative and qualitative methods simultaneously to study the same general questions and to compare the results. If the results of the quantitative and qualitative methods come to the same general conclusion, they reinforce and enrich each other. Using qualitative research can often help clarify quantitative results. For example, Trenor and colleagues investigated the university experiences of female engineering students. In the first phase, female engineering students completed a survey, where they assessed their perceptions of the University, including their sense of belonging. Statistically, the various ethnic groups showed no differences in their ratings of sense of belonging. One might conclude from these data that ethnicity does not have anything to do with sense of belonging to a college or university. However, in the second phase of their study, the authors also conducted interviews with the students, in which many minority students reported how diversity at the university enhanced their sense of belonging (Trenor et al., 2008). Without the qualitative component, they might have drawn the wrong conclusion about the quantitative results.
There are two other important types of research study that we want to discuss in this section, they are Case Studies and Participatory Action Research. Both often use qualitative and quantitative data.
Case Studies
Case studies are detailed, often lengthy studies of a very small number of individuals (sometimes as few as only one). Case studies have been used throughout the history of psychology to better understand the mind and behavior. For example, Sigmund Freud developed psychoanalytical theory based on case studies of his patients. Case studies are frequently used in clinical psychology to better understand psychological and neurological disorders. One downside of case studies is that we do not know how generalizable the findings are to the general population, because only small numbers of participants are studied.
Participatory Action Research
Participatory Action Research (PAR) is a research framework that aims to bring about social change. The research is guided by the needs and desires of community members who are grappling with specific social justice issues in their community. Community members work in collaboration with academic researchers as partners in a research team. Unlike most other kinds of research study in psychology, community members are active participants in all stages of PAR projects. PAR projects not only provide information about a community issue, but they also result in some kind of action designed to bring about improvements (Carleton College, n.d.; Fine & Torre, 2019). An example of PAR includes the Morris Justice Project. Maria Elena Torre and Brett Stoudt, two scholar-activists from City University of New York (CUNY) collaborated with community members in the Morris Avenue area of the Bronx to document the experiences and impact of aggressive policing on the community. This area had particularly high rates of “stop and frisk” of young Black men. Together they formulated a research plan, and community members surveyed over 1000 people in the neighborhood. They disseminated this information in multiple formats, including a report, buttons, and t-shirts, and at various community events. The project was successful in raising awareness of the problem among multiple groups, including the NYPD and people who lived in other neighborhoods. It was also used to support legal action against police officers, and recent legislation (Safer Communities Act, 2022) to protect people of color from discriminatory police practices.
Personal Application Questions
- Consider a situation where you are trying to make a personal decision based on information from a research study, such as choosing a particular therapy or adopting a specific study habit. What are some potential pitfalls or biases that you should be aware of when interpreting the results of a single study? How might you seek additional information or perspectives to make a more informed decision?
- As a college student, you are no doubt concerned about the grades that you earn while completing your coursework. If you wanted to know how overall grade point average (GPA) is related to success in life after college, how would you choose to approach this question and what kind of resources would you need to conduct this research?
- Take a few minutes to think about all of the advancements that our society has achieved as a function of research involving animal subjects. How have you, a friend, or a family member benefited directly from this kind of research?
- Imagine you are conducting a Participatory Action Research (PAR) project in your community to address a social justice issue. Describe the issue and the steps you would take to ensure effective collaboration with community members and academic researchers, and how you would implement the findings to bring about positive change. Refer to the Morris Justice Project as an example.
- Consider the influence of personal biases and expectations on the interpretation of research findings that you might read about in the news or on social media. How might your own beliefs, values, or preconceived notions about a topic influence how you interpret research studies? What strategies can you employ to minimize the impact of bias and approach research findings with a more objective mindset?
- Reflect on the ethical considerations associated with research studies involving human participants. Why is it important to be aware of the ethical guidelines and practices in research, even as a consumer of research findings? How might your awareness of ethical issues influence your support for or skepticism towards certain research studies or practices?
Critical Thinking
- Recently a study was published in the journal, Nutrition and Cancer, which established a negative correlation between coffee consumption and breast cancer. Specifically, it was found that women consuming more than 5 cups of coffee a day were less likely to develop breast cancer than women who never consumed coffee (Lowcock et al., 2013). Imagine you see a newspaper story about this research that says, “Coffee Protects Against Cancer.” Why is this headline misleading and why would a more accurate headline draw less interest?
- Sometimes, true random sampling can be very difficult to obtain. Many researchers make use of convenience samples as an alternative. For example, one popular convenience sample would involve students enrolled in Introduction to Psychology courses. What are the pros and cons of using this sampling technique?
- Peer review is an important part of publishing research findings in many scientific disciplines. This process is normally conducted anonymously; in other words, the author of the article being reviewed does not know who is reviewing the article, and the reviewers are unaware of the author’s identity. Why would this be an important part of this process?
- Suppose you are interested in exploring the relationship between sleep quality and academic performance among college students. How would you design a correlational study to examine this relationship? Identify the variables involved, and discuss the potential limitations of correlational research in establishing causality.
- Considering the advantages and disadvantages of naturalistic observation, how would you approach conducting an observational study on children’s social interactions in a school setting? Discuss the ethical considerations involved and propose strategies to minimize observer bias and maintain the ecological validity of your study.
