
19 11. Quantitative measurement
Chapter Outline
- Overview of measurement (11 minute read)
- Operationalization and levels of measurement (20 minute read)
- Scales and indices (15 minute read)
- Reliability and validity (20 minute read)
- Ethical and social justice considerations for measurement (6 minute read)
Content warning: Discussions of immigration issues, parents and gender identity, anxiety, and substance use.
11.1 Overview of measurement
Learning Objectives
Learners will be able to…
- Provide an overview of the measurement process in social work research
- Describe why accurate measurement is important for research
This chapter begins with an interesting question: Is my apple the same as your apple? Let’s pretend you want to study apples. Perhaps you have read that chemicals in apples may impact neurotransmitters and you want to test if apple consumption improves mood among college students. So, in order to conduct this study, you need to make sure that you provide apples to a treatment group, right? In order to increase the rigor of your study, you may also want to have a group of students, ones who do not get to eat apples, to serve as a comparison group. Don’t worry if this seems new to you. We will discuss this type of design in Chapter 13. For now, just concentrate on apples.
In order to test your hypothesis about apples, you need to define exactly what is meant by the term “apple” so you ensure everyone is consuming the same thing. You also need to know what you consider a “dose” of this thing that we call “apple” and make sure everyone is consuming the same kind of apples and you need a way to ensure that you give the same amount of apples to everyone in your treatment group. So, let’s start by making sure we understand what the term “apple” means. Say you have an object that you identify as an apple and I have an object that I identify as an apple. Perhaps my “apple” is a chocolate apple, one that looks similar to an apple but made of chocolate and red dye, and yours is a honeycrisp. Perhaps yours is papier-mache and mine is a Macbook Pro. All of these are defined as apples, right?

You can see the multitude of ways we could conceptualize “apple,” and how that could create a problem for our research. If I get a Red Delicious (ick) apple and you get a Granny Smith (yum) apple and we observe a change in neurotransmitters, it’s going to be even harder than usual to say the apple influenced the neurotransmitters because we didn’t define “apple” well enough. Measurement in this case is essential to treatment fidelity, which is when you ensure that everyone receives the same, or close to the same, treatment as possible. In other words, you need to make sure everyone is consuming the same kind of apples and you need a way to ensure that you give the same amount of apples to everyone in your treatment group.
In social science, when we use the term measurement, we mean the process by which we describe and ascribe meaning to the key facts, concepts, or other phenomena that we are investigating. At its core, measurement is about defining one’s terms in as clear and precise a way as possible. Of course, measurement in social science isn’t quite as simple as using a measuring cup or spoon, but there are some basic tenets on which most social scientists agree when it comes to measurement. We’ll explore those, as well as some of the ways that measurement might vary depending on your unique approach to the study of your topic.
An important point here is that measurement does not require any particular instruments or procedures. What it does require is some systematic procedure for assigning scores, meanings, and descriptions to individuals or objects so that those scores represent the characteristic of interest. You can measure phenomena in many different ways, but you must be sure that how you choose to measure gives you information and data that lets you answer your research question. If you’re looking for information about a person’s income, but your main points of measurement have to do with the money they have in the bank, you’re not really going to find the information you’re looking for!
What do social scientists measure?
The question of what social scientists measure can be answered by asking yourself what social scientists study. Think about the topics you’ve learned about in other social work classes you’ve taken or the topics you’ve considered investigating yourself. Let’s consider Melissa Milkie and Catharine Warner’s study (2011)[1] of first graders’ mental health. In order to conduct that study, Milkie and Warner needed to have some idea about how they were going to measure mental health. What does mental health mean, exactly? And how do we know when we’re observing someone whose mental health is good and when we see someone whose mental health is compromised? Understanding how measurement works in research methods helps us answer these sorts of questions.
As you might have guessed, social scientists will measure just about anything that they have an interest in investigating. For example, those who are interested in learning something about the correlation between social class and levels of happiness must develop some way to measure both social class and happiness. Those who wish to understand how well immigrants cope in their new locations must measure immigrant status and coping. Those who wish to understand how a person’s gender shapes their workplace experiences must measure gender and workplace experiences. You get the idea. Social scientists can and do measure just about anything you can imagine observing or wanting to study. Of course, some things are easier to observe or measure than others.
In 1964, philosopher Abraham Kaplan (1964)[2] wrote The Conduct of Inquiry, which has since become a classic work in research methodology (Babbie, 2010).[3] In his text, Kaplan describes different categories of things that behavioral scientists observe. One of those categories, which Kaplan called “observational terms,” is probably the simplest to measure in social science. Observational terms are the sorts of things that we can see with the naked eye simply by looking at them. Kaplan roughly defines them as conditions that are easy to identify and verify through direct observation. If, for example, we wanted to know how the conditions of playgrounds differ across different neighborhoods, we could directly observe the variety, amount, and condition of equipment at various playgrounds.
Indirect observables, on the other hand, are less straightforward to assess. In Kaplan’s framework, they are conditions that are subtle and complex that we must use existing knowledge and intuition to define.If we conducted a study for which we wished to know a person’s income, we’d probably have to ask them their income, perhaps in an interview or a survey. Thus, we have observed income, even if it has only been observed indirectly. Birthplace might be another indirect observable. We can ask study participants where they were born, but chances are good we won’t have directly observed any of those people being born in the locations they report.
How do social scientists measure?
Measurement in social science is a process. It occurs at multiple stages of a research project: in the planning stages, in the data collection stage, and sometimes even in the analysis stage. Recall that previously we defined measurement as the process by which we describe and ascribe meaning to the key facts, concepts, or other phenomena that we are investigating. Once we’ve identified a research question, we begin to think about what some of the key ideas are that we hope to learn from our project. In describing those key ideas, we begin the measurement process.
Let’s say that our research question is the following: How do new college students cope with the adjustment to college? In order to answer this question, we’ll need some idea about what coping means. We may come up with an idea about what coping means early in the research process, as we begin to think about what to look for (or observe) in our data-collection phase. Once we’ve collected data on coping, we also have to decide how to report on the topic. Perhaps, for example, there are different types or dimensions of coping, some of which lead to more successful adjustment than others. However we decide to proceed, and whatever we decide to report, the point is that measurement is important at each of these phases.
As the preceding example demonstrates, measurement is a process in part because it occurs at multiple stages of conducting research. We could also think of measurement as a process because it involves multiple stages. From identifying your key terms to defining them to figuring out how to observe them and how to know if your observations are any good, there are multiple steps involved in the measurement process. An additional step in the measurement process involves deciding what elements your measures contain. A measure’s elements might be very straightforward and clear, particularly if they are directly observable. Other measures are more complex and might require the researcher to account for different themes or types. These sorts of complexities require paying careful attention to a concept’s level of measurement and its dimensions. We’ll explore these complexities in greater depth at the end of this chapter, but first let’s look more closely at the early steps involved in the measurement process, starting with conceptualization.
The idea of coming up with your own measurement tool might sound pretty intimidating at this point. The good news is that if you find something in the literature that works for you, you can use it with proper attribution. If there are only pieces of it that you like, you can just use those pieces, again with proper attribution. You don’t always have to start from scratch!
Key Takeaways
- Measurement (i.e. the measurement process) gives us the language to define/describe what we are studying.
- In research, when we develop measurement tools, we move beyond concepts that may be subjective and abstract to a definition that is clear and concise.
- Good social work researchers are intentional with the measurement process.
- Engaging in the measurement process requires us to think critically about what we want to study. This process may be challenging and potentially time-consuming.
Exercises
- As you read this chapter, think about the topics that you are interested in studying and answer the following.
- How easy or difficult do you believe it will be to study these topics?
- Think about the chapter on literature reviews. Is there a significant body of literature on the topics you are interested in studying?
- Are there existing measurement tools that may be appropriate to use for the topics you are interested in studying?
11.2 Operationalization and levels of measurement
Learning Objectives
Learners will be able to…
- Define constructs and operationalization and describe their relationship
- Be able to start operationalizing variables in your research project
- Identify the level of measurement for each type of variable
- Demonstrate knowledge of how each type of variable can be used
Now we have some ideas about what and how social scientists need to measure, so let’s get into the details. In this section, we are going to talk about how to make your variables measurable (operationalization) and how you ultimately characterize your variables in order to analyze them (levels of measurement).
Operationalizing your variables
“Operationalizing” is not a word I’d ever heard before I became a researcher, and actually, my browser’s spell check doesn’t even recognize it. I promise it’s a real thing, though. In the most basic sense, when we operationalize a variable, we break it down into measurable parts. Operationalization is the process of determining how to measure a construct that cannot be directly observed. And a constructs are conditions that are not directly observable and represent states of being, experiences, and ideas. But why construct? We call them constructs because they are built using different ideas and parameters.
As we know from Section 11.1, sometimes the measures that we are interested in are more complex and more abstract than observational terms or indirect observables. Think about some of the things you’ve learned about in other social work classes—for example, ethnocentrism. What is ethnocentrism? Well, from completing an introduction to social work class you might know that it’s a construct that has something to do with the way a person judges another’s culture. But how would you measure it? Here’s another construct: bureaucracy. We know this term has something to do with organizations and how they operate, but measuring such a construct is trickier than measuring, say, a person’s income. In both cases, ethnocentrism and bureaucracy, these theoretical notions represent ideas whose meaning we have come to agree on. Though we may not be able to observe these abstractions directly, we can observe the things that they are made up of.

Now, let’s operationalize bureaucracy and ethnocentrism. The construct of bureaucracy could be measured by counting the number of supervisors that need to approve routine spending by public administrators. The greater the number of administrators that must sign off on routine matters, the greater the degree of bureaucracy. Similarly, we might be able to ask a person the degree to which they trust people from different cultures around the world and then assess the ethnocentrism inherent in their answers. We can measure constructs like bureaucracy and ethnocentrism by defining them in terms of what we can observe.
How we operationalize our constructs (and ultimately measure our variables) can affect the conclusions we can draw from our research. Let’s say you’re reviewing a state program to make it more efficient in connecting people to public services. What might be different if we decide to measure bureaucracy by the number of forms someone has to fill out to get a public service instead of the number of people who have to review the forms, like we talked about above? Maybe you find that there is an unnecessary amount of paperwork based on comparisons to other state programs, so you recommend that some of it be eliminated. This is probably a good thing, but will it actually make the program more efficient like eliminating some of the reviews that paperwork has to go through would? I’m not really making a judgment on which way is better to measure bureaucracy, but I encourage you to think about the costs and benefits of each way we operationalized the construct of bureaucracy, and extend this to the way you operationalize your own concepts in your research project.
Levels of Measurement
Now, we’re going to move into some more concrete characterizations of variables. You now hopefully understand how to operationalize your concepts so that you can turn them into variables. Imagine a process kind of like what you see in Figure 11.1 below.
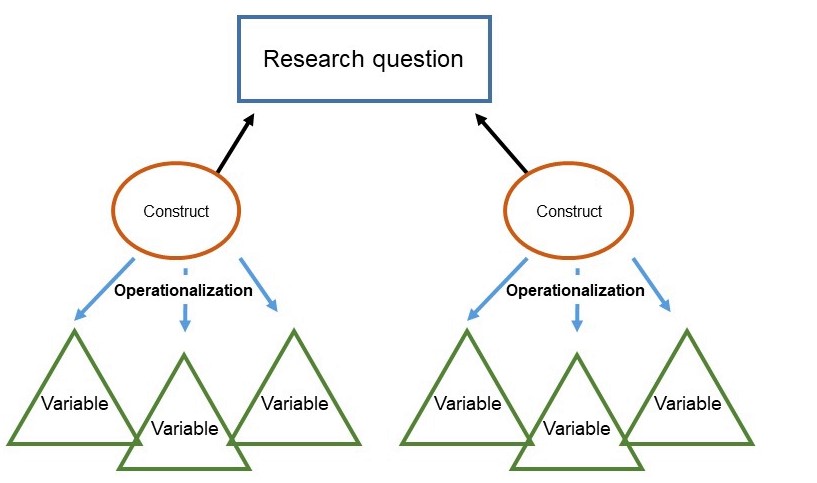
Notice that the arrows from the construct point toward the research question, because ultimately, measuring them will help answer your question!
The level of measurement of a variable tells us how the values of the variable relate to each other and what mathematical operations we can perform with the variable. (That second part will become important once we move into quantitative analysis in Chapter 14 and Chapter 15). Many students find this definition a bit confusing. What does it mean when we say that the level of measurement tells us about mathematical operations? So before we move on, let’s clarify this a bit.
Let’s say you work for your a community nonprofit that wants to develop programs relevant to community members’ ages (i.e., tutoring for kids in school, job search and resume help for adults, and home visiting for elderly community members). However, you do not have a good understanding of the ages of the people who visit your community center. Below is a part of a questionnaire that you developed to.
- How old are you?
– Under 18 years old
– 18-30 years old
– 31-50 years old
– 51-60 years old
– Over 60 years old - How old are you? _____ years
Look at the two items on this questionnaire. They both ask about age, but the first item asks about age but asks the participant to identify the age range. The second item asks you to identify the actual age in years. These two questions give us data that represent the same information measured at a different level.
It would help your agency if you knew the average age of clients, right? So, which item on the questionnaire will provide this information? Item one’s choices are grouped into categories. Can you compute an average age from these choices? No. Conversely, participants completing item two are asked to provide an actual number, one that you could use to determine an average age. In summary, the two items both ask the participants to report their age. However, the type of data collected from both items is different and must be analyzed differently.
Levels of Measurement
We can think about the four levels of measurement as going from less to more specific, or as it’s more commonly called, lower to higher: nominal, ordinal, interval, and ratio. Each of these levels differ and help the researcher understand something about their data. Think about levels of measurement as a hierarchy.
In order to determine the level of measurement, please examine your data and then ask these four questions (in order).
- Do I have mutually exclusive categories? If the answer is yes, continue to question #2.
- Do my item choices have a hierarchy or order? In other words, can you put your item choices in order? If no, stop–you have nominal level data. If the answer is yes, continue to question #3.
- Can I add, subtract, divide, and multiply my answer choices? If no, stop–you have ordinal level data. If the answer is yes, continue to question #4.
- Is it possible that the answer to this item can be zero? If the answer is no—you have interval level data. If the answer is yes, you are at the ratio level of measurement.
Nominal level. The nominal level of measurement is the lowest level of measurement. It contains categories are mutually exclusive, which means means that anyone who falls into one category cannot not fall into another category. The data can be represented with words (like yes/no) or numbers that correspond to words or a category (like 1 equaling yes and 0 equaling no). Even when the categories are represented as numbers in our data, the number itself does not have an actual numerical value. It is merely a number we have assigned so that we can use the variable in mathematical operations (which we will start talking about in Chapter 14.1). We say this level of measurement is lowest or least specific because someone who falls into a category we’ve designated could differ from someone else in the same category. Let’s say on our questionnaire above, we also asked folks whether they own a car. They can answer yes or no, and they fall into mutually exclusive categories. In this case, we would know whether they own a car, but not whether owning a car really affects their life significantly. Maybe they have chosen not to own one and are happy to take the bus, bike, or walk. Maybe they do not own one but would like to own one. We cannot get this information from a nominal variable, which is ok when we have meaningful categories. Nominal variables are especially useful when we just need the frequency of a particular characteristic in our sample.
The nominal level of measurement usually includes many demographic characteristics like race, gender, or marital status.
Ordinal level. The ordinal level of measurement is the next level of measurement and contains slightly more specific information than the nominal level. This level has mutually exclusive categories and a hierarchy or order. Let’s go back to the first item on the questionnaire we talked about above.
- How old are you?
– Under 18 years old
– 18-30 years old
– 31-50 years old
– 51-60 years old
– Over 60 years old
Do we have mutually exclusive categories? Yes. Someone who selects item A cannot also select item B. So, we know that we have at least nominal level data. However, the next question that we need to ask is “Do my answer choices have order?” or “Can I put my answer choices in order?” The answer is yes, someone who selects A is younger than someone who selects B or C. So, you have at least ordinal level data.
From a data analysis and statistical perspective, ordinal variables get treated exactly like nominal variables because they are both categorical variables, or variables whose values are organized into mutually exclusive groups but whose numerical values cannot be used in mathematical operations. You’ll see this term used again when we get into bivariate analysis in Chapter 15.
Interval levelThe interval level of measurement is a higher level of measurement. This level marks the point where we are able . This level contains all of the characteristics of the previous levels (mutually exclusive categories and order). What distinguishes it from the ordinal level is that the interval level can be used to conduct mathematical computations with data (like an average, for instance).
Let’s think back to our questionnaire about age again and take a look at the second question where we asked for a person’s exact age in years. Age in years is mutually exclusive – someone can’t be 14 and 15 at the same time – and the order of ages is meaningful, since being 18 means something different than being 32. Now, we can also take the answers to this question and do math with them, like addition, subtraction, multiplication, and division.
Ratio level. Ratio level data is the highest level of measurement. It has mutually exclusive categories, order, and you can perform mathematical operations on it. The main difference between the interval and ratio levels is that the ratio level has an absolute zero, meaning that a value of zero is both possible and meaningful. You might be thinking, “Well, age has an absolute zero,” but someone who is not yet born does not have an age, and the minute they’re born, they are not zero years old anymore.
Data at the ratio level of measurement are usually amounts or numbers of things, and can be negative (if that makes conceptual sense, of course). For example, you could ask someone to report how many A’s they have on their transcript or how many semesters they have earned a 4.0. They could have zero A’s and that would be a valid answer.
From a data analysis and statistical perspective, interval and ratio variables are treated exactly the same because they are both continuous variables, or variables whose values are mutually exclusive and can be used in mathematical operations. Technically, a continuous variable could have an infinite number of values.
What does the level of measurement tell us?
We have spent time learning how to determine our data’s level of measurement. Now what? How could we use this information to help us as we measure concepts and develop measurement tools? First, the types of statistical tests that we are able to use are dependent on our data’s level of measurement. (We will discuss this soon in Chapter 15.) The higher the level of measurement, the more complex statistical tests we are able to conduct. This knowledge may help us decide what kind of data we need to gather, and how. That said, we have to balance this knowledge with the understanding that sometimes, collecting data at a higher level of measurement could negatively impact our studies. For instance, sometimes providing answers in ranges may make prospective participants feel more comfortable responding to sensitive items. Imagine that you were interested in collecting information on topics such as income, number of sexual partners, number of times used illicit drugs, etc. You would have to think about the sensitivity of these items and determine if it would make more sense to collect some data at a lower level of measurement.
Finally, sometimes when analyzing data, researchers find a need to change a data’s level of measurement. For example, a few years ago, a student was interested in studying the relationship between mental health and life satisfaction. This student collected a variety of data. One item asked about the number of mental health diagnoses, reported as the actual number. When analyzing data, my student examined the mental health diagnosis variable and noticed that she had two groups, those with none or one diagnosis and those with many diagnoses. Instead of using the ratio level data (actual number of mental health diagnoses), she collapsed her cases into two categories, few and many. She decided to use this variable in her analyses. It is important to note that you can move a higher level of data to a lower level of data; however, you are unable to move a lower level to a higher level.
Key Takeaways
- Operationalization involves figuring out how to measure a construct you cannot directly observe.
- There are four levels of measurement for variables.
- Nominal variables have mutually exclusive categories with no natural order. They cannot be used for mathematical operations like addition or subtraction. Race or gender would be one example.
- Ordinal variables have mutually exclusive categories and a natural order. They also cannot be used for mathematical operations like addition or subtraction. Age when measured in categories (i.e., 18-25 years old) would be an example.
- Interval variables have mutually exclusive categories, a natural order, and can be used for mathematical operations. Age as a raw number would be an example.
- Ratio variables have mutually exclusive categories, a natural order, can be used for mathematical operations, and have an absolute zero value. The number of times someone calls a legislator to advocate for a policy would be an example.
- Nominal and ordinal variables are categorical variables, meaning they have mutually exclusive categories and cannot be used for mathematical operations, even when assigned a number.
- Interval and ratio variables are continuous variables, meaning their values are mutually exclusive and can be used in mathematical operations.
- Researchers should consider the costs and benefits of how they operationalize their variables, including what level of measurement they choose, since the level of measurement can affect how you must gather your data.
Exercises
- Think about some of the variables in the research project you are considering. If you haven’t identified any just yet, consider some of the ones you have seen in scholarly literature about your topic.
- What are the primary constructs being explored in the research?
- Could you (or the study authors) have chosen another way to operationalize this construct?
- What are these variables’ levels of measurement?
- Are they categorical or continuous?
11.3 Scales and indices
Learning Objectives
Learners will be able to…
- Identify different types of scales and compare them to each other
- Understand how to begin the process of constructing scales or indices
Quantitative data analysis requires the construction of two types of measures of variables: indices and scales. These measures are frequently used and are important since social scientists often study variables that possess no clear and unambiguous indicators–for instance, age or gender. Researchers often centralize much of work in regards to the attitudes and orientations of a group of people, which require several items to provide indication of the variables. Secondly, researchers seek to establish ordinal categories from very low to very high (vice-versa), which single data items can not ensure, while an index or scale can.
Although they exhibit differences (which will later be discussed) the two have in common various factors.
- Both are ordinal measures of variables.
- Both can order the units of analysis in terms of specific variables.
- Both are composite measures of variables (measurements based on more than one one data item).
In general, indices are a sum of series of individual yes/no questions, that are then combined in a single numeric score. They are usually a measure of the quantity of some social phenomenon and are constructed at a ratio level of measurement. More sophisticated indices weigh individual items according to their importance in the concept being measured (i.e. in a multiple choice test where different questions are worth different numbers of points). Some interval-level indices are not weight counted, but contain other indexes or scales within them (i.e. college admissions that score an applicant based on GPA, SAT scores, essays, and place a different point from each source).
This section discusses two formats used for measurement in research: scales and indices (sometimes called indexes). These two formats are helpful in research because they use multiple indicators to develop a composite (or total) score. Composite scores provide a much greater understanding of concepts than a single item could. Although we won’t delve too deeply into the process of scale development, we will cover some important topics for you to understand how scales and indices can be used.
Types of scales
As a student, you are very familiar with end of the semester course evaluations. These evaluations usually include statements such as, “My instructor created an environment of respect” and ask students to use a scale to indicate how much they agree or disagree with the statements. These scales, if developed and administered appropriately, provide a wealth of information to instructors that may be used to refine and update courses. If you examine the end of semester evaluations, you will notice that they are organized, use language that is specific to your course, and have very intentional methods of implementation. In essence, these tools are developed to encourage completion.
As you read about these scales, think about the information that you want to gather from participants. What type or types of scales would be the best for you to use and why? Are there existing scales or do you have to create your own?
The Likert scale
Most people have seen some version of a Likert scale. Designed by Rensis Likert (Likert, 1932)[4], a Likert scale is a very popular rating scale for measuring ordinal data in social work research. This scale includes Likert items that are simply-worded statements to which participants can indicate their extent of agreement or disagreement on a five- or seven-point scale ranging from “strongly disagree” to “strongly agree.” You will also see Likert scales used for importance, quality, frequency, and likelihood, among lots of other concepts. Below is an example of how we might use a Likert scale to assess your attitudes about research as you work your way through this textbook.
| Strongly agree | Agree | Neutral | Disagree | Strongly disagree | |
| I like research more now than when I started reading this book. | |||||
| This textbook is easy to use. | |||||
| I feel confident about how well I understand levels of measurement. | |||||
| This textbook is helping me plan my research proposal. |
Likert scales are excellent ways to collect information. They are popular; thus, your prospective participants may already be familiar with them. However, they do pose some challenges. You have to be very clear about your question prompts. What does strongly agree mean and how is this differentiated from agree? In order to clarify this for participants, some researchers will place definitions of these items at the beginning of the tool.
There are a few other, less commonly used, scales discussed next.
Semantic differential scale
This is a composite (multi-item) scale where respondents are asked to indicate their opinions or feelings toward a single statement using different pairs of adjectives framed as polar opposites. For instance, in the above Likert scale, the participant is asked how much they agree or disagree with a statement. In a semantic differential scale, the participant is asked to indicate how they feel about a specific item. This makes the semantic differential scale an excellent technique for measuring people’s attitudes or feelings toward objects, events, or behaviors. The following is an example of a semantic differential scale that was created to assess participants’ feelings about the content taught in their research class.
Feelings About My Research Class
Directions: Please review the pair of words and then select the one that most accurately reflects your feelings about the content of your research class.
Boring……………………………………….Exciting
Waste of Time…………………………..Worthwhile
Dry…………………………………………….Engaging
Irrelevant…………………………………..Relevant
Guttman scale
This composite scale was designed by Louis Guttman and uses a series of items arranged in increasing order of intensity (least intense to most intense) of the concept. This type of scale allows us to understand the intensity of beliefs or feelings. Each item in the above Guttman scale has a weight (this is not indicated on the tool) which varies with the intensity of that item, and the weighted combination of each response is used as an aggregate measure of an observation. Let’s pretend that you are working with a group of parents whose children have identified as part of the transgender community. You want to know how comfortable they feel with their children. You could develop the following items.
Example Guttman Scale Items
- I would allow my child to use a name that was not gender-specific (e.g., Ryan, Taylor) Yes/No
- I would allow my child to wear clothing of the opposite gender (e.g., dresses for boys) Yes/No
- I would allow my child to use the pronoun of the opposite sex Yes/No
- I would allow my child to live as the opposite gender Yes/No
Notice how the items move from lower intensity to higher intensity. A researcher reviews the yes answers and creates a score for each participant.
Indices (Indexes)
An index is a composite score derived from aggregating measures of multiple concepts (called components) using a set of rules and formulas. It is different from a scale. Scales also aggregate measures; however, these measures examine different dimensions or the same dimension of a single construct. A well-known example of an index is the consumer price index (CPI), which is computed every month by the Bureau of Labor Statistics of the U.S. Department of Labor. The CPI is a measure of how much consumers have to pay for goods and services (in general) and is divided into eight major categories (food and beverages, housing, apparel, transportation, healthcare, recreation, education and communication, and “other goods and services”), which are further subdivided into more than 200 smaller items. Each month, government employees call all over the country to get the current prices of more than 80,000 items. Using a complicated weighting scheme that takes into account the location and probability of purchase for each item, analysts then combine these prices into an overall index score using a series of formulas and rules.
Another example of an index is the Duncan Socioeconomic Index (SEI). This index is used to quantify a person’s socioeconomic status (SES) and is a combination of three concepts: income, education, and occupation. Income is measured in dollars, education in years or degrees achieved, and occupation is classified into categories or levels by status. These very different measures are combined to create an overall SES index score. However, SES index measurement has generated a lot of controversy and disagreement among researchers.
The process of creating an index is similar to that of a scale. First, conceptualize (define) the index and its constituent components. Though this appears simple, there may be a lot of disagreement on what components (concepts/constructs) should be included or excluded from an index. For instance, in the SES index, isn’t income correlated with education and occupation? And if so, should we include one component only or all three components? Reviewing the literature, using theories, and/or interviewing experts or key stakeholders may help resolve this issue. Second, operationalize and measure each component. For instance, how will you categorize occupations, particularly since some occupations may have changed with time (e.g., there were no Web developers before the Internet)? Third, create a rule or formula for calculating the index score. Again, this process may involve a lot of subjectivity. Lastly, validate the index score using existing or new data.
Differences Between Scales and Indices
Though indices and scales yield a single numerical score or value representing a concept of interest, they are different in many ways. First, indices often comprise components that are very different from each other (e.g., income, education, and occupation in the SES index) and are measured in different ways. Conversely, scales typically involve a set of similar items that use the same rating scale (such as a five-point Likert scale about customer satisfaction).
Second, indices often combine objectively measurable values such as prices or income, while scales are designed to assess subjective or judgmental constructs such as attitude, prejudice, or self-esteem. Some argue that the sophistication of the scaling methodology makes scales different from indexes, while others suggest that indexing methodology can be equally sophisticated. Nevertheless, indexes and scales are both essential tools in social science research.
A note on scales and indices
Scales and indices seem like clean, convenient ways to measure different phenomena in social science, but just like with a lot of research, we have to be mindful of the assumptions and biases underneath. What if a scale or an index was developed using only White women as research participants? Is it going to be useful for other groups? It very well might be, but when using a scale or index on a group for whom it hasn’t been tested, it will be very important to evaluate the validity and reliability of the instrument, which we address in the next section.
It’s important to note that while scales and indices are often made up of nominal or ordinal variables, when we analyze them into composite scores, we will treat them as interval/ratio variables.
Key Takeaways
- Scales and indices are common ways to collect information and involve using multiple indicators in measurement.
- A key difference between a scale and an index is that a scale contains multiple indicators for one concept, whereas an indicator examines multiple concepts (components).
- In order to create scales or indices, researchers must have a clear understanding of the indicators for what they are studying.
Exercises
- Use the research question that you developed in the previous chapters and find a related scale or index that researchers have used. If you have trouble finding the exact phenomenon you want to study, get as close as you can.
- What is the level of measurement for each item on each tool? Take a second and think about why the tool’s creator decided to include these levels of measurement. Identify any levels of measurement you would change and why.
- If these tools don’t exist for what you are interested in studying, why do you think that is?
11.4 Reliability and validity in measurement
Learning Objectives
Learners will be able to…
- Discuss measurement error, the different types, and how to minimize the probability of them
- Differentiate between reliability and validity and understand how these are related to each other and relevant to understanding the value of a measurement tool
- Compare and contrast the types of reliability and demonstrate how to evaluate each type
- Compare and contrast the types of validity and demonstrate how to evaluate each type
The previous chapter provided insight into measuring concepts in social work research. We discussed the importance of identifying concepts and their corresponding indicators as a way to help us operationalize them. In essence, we now understand that when we think about our measurement process, we must be intentional and thoughtful in the choices that we make. Before we talk about how to evaluate our measurement process, let’s discuss why we want to evaluate our process. We evaluate our process so that we minimize our chances of error. But what is measurement error?
Types of Errors
We need to be concerned with two types of errors in measurement: systematic and random errors. Systematic errors are errors that are generally predictable. These are errors that, “are due to the process that biases the results.”[5] For instance, my cat stepping on the scale with me each morning is a systematic error in measuring my weight. I could predict that each measurement would be off by 13 pounds. (He’s a bit of a chonk.)
There are multiple categories of systematic errors.
- Social desirability, occurs when you ask participants a question and they answer in the way that they feel is the most socially desired. For instance, let's imagine that you want to understand the level of prejudice that participants feel regarding immigrants and decide to conduct face-to-face interviews with participants. Some participants may feel compelled to answer in a way that indicates that they are less prejudiced than they really are.
- [pb_glossary id="2096"]Acquiescence bias occurs when participants answer items in some type of pattern, usually skewed to more favorable responses. For example, imagine that you took a research class and loved it. The professor was great and you learned so much. When asked to complete the end of course questionnaire, you immediately mark "strongly agree" to all items without really reading all of the items. After all, you really loved the class. However, instead of reading and reflecting on each item, you "acquiesced" and used your overall impression of the experience to answer all of the items.
- Leading questions are those questions that are worded in a way so that the participant is "lead" to a specific answer. For instance, think about the question, "Have you ever hurt a sweet, innocent child?" Most people, regardless of their true response, may answer "no" simply because the wording of the question leads the participant to believe that "no" is the correct answer.
In order to minimize these types of errors, you should think about what you are studying and examine potential public perceptions of this issue. Next, think about how your questions are worded and how you will administer your tool (we will discuss these in greater detail in the next chapter). This will help you determine if your methods inadvertently increase the probability of these types of errors.
These errors differ from random errors, whic are "due to chance and are not systematic in any way."[6] Sometimes it is difficult to "tease out" random errors. When you take your statistics class, you will learn more about random errors and what to do about them. They're hard to observe until you start diving deeper into statistical analysis, so put a pin in them for now.
Now that we have a good understanding of the two types of errors, let's discuss what we can do to evaluate our measurement process and minimize the chances of these occurring. Remember, quality projects are clear on what is measured, how it is measured, and why it is measured. In addition, quality projects are attentive to the appropriateness of measurement tools and evaluate whether tools are used correctly and consistently. But how do we do that? Good researchers do not simply assume that their measures work. Instead, they collect data to demonstrate that they work. If their research does not demonstrate that a measure works, they stop using it. There are two key factors to consider in deciding whether your measurements are good: reliability and validity.
Reliability
Reliability refers to the consistency of a measure. Psychologists consider three types of reliability: over time (test-retest reliability), across items (internal consistency), and across different researchers (inter-rater reliability).
Test-retest reliability
When researchers measure a construct that they assume to be consistent across time, then the scores they obtain should also be consistent across time. Test-retest reliability is the extent to which this is actually the case. For example, intelligence is generally thought to be consistent across time. A person who is highly intelligent today will be highly intelligent next week. This means that any good measure of intelligence should produce roughly the same scores for this individual next week as it does today. Clearly, a measure that produces highly inconsistent scores over time cannot be a very good measure of a construct that is supposed to be consistent.
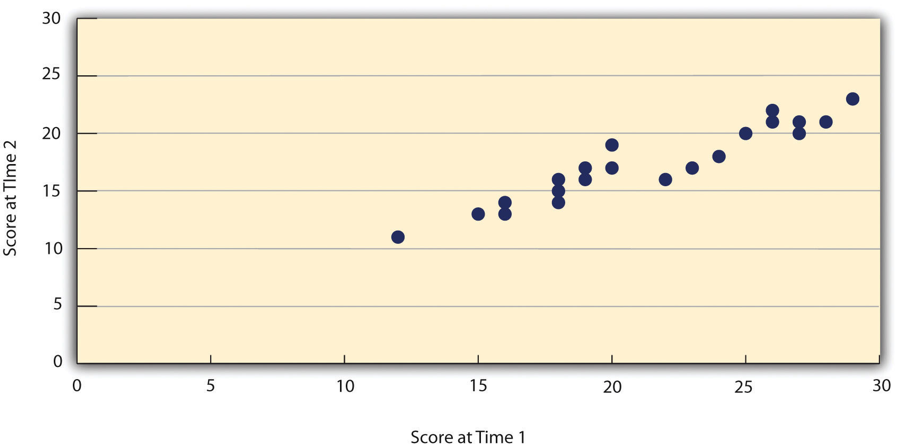
Assessing test-retest reliability requires using the measure on a group of people at one time, using it again on the same group of people at a later time. At neither point has the research participant received any sort of intervention. Once you have these two measurements, you then look at the correlation between the two sets of scores. This is typically done by graphing the data in a scatterplot and computing the correlation coefficient. Figure 11.2 shows the correlation between two sets of scores of several university students on the Rosenberg Self-Esteem Scale, administered two times, a week apart. The correlation coefficient for these data is +.95. In general, a test-retest correlation of +.80 or greater is considered to indicate good reliability.
Again, high test-retest correlations make sense when the construct being measured is assumed to be consistent over time, which is the case for intelligence, self-esteem, and the Big Five personality dimensions. But other constructs are not assumed to be stable over time. The very nature of mood, for example, is that it changes. So a measure of mood that produced a low test-retest correlation over a period of a month would not be a cause for concern.
Internal consistency
Another kind of reliability is internal consistency, which is the consistency of people’s responses across the items on a multiple-item measure. In general, all the items on such measures are supposed to reflect the same underlying construct, so people’s scores on those items should be correlated with each other. On the Rosenberg Self-Esteem Scale, people who agree that they are a person of worth should tend to agree that they have a number of good qualities. If people’s responses to the different items are not correlated with each other, then it would no longer make sense to claim that they are all measuring the same underlying construct. This is as true for behavioral and physiological measures as for self-report measures. For example, people might make a series of bets in a simulated game of roulette as a measure of their level of risk seeking. This measure would be internally consistent to the extent that individual participants’ bets were consistently high or low across trials.
Interrater Reliability
Many behavioral measures involve significant judgment on the part of an observer or a rater. Interrater reliability is the extent to which different observers are consistent in their judgments. For example, if you were interested in measuring university students’ social skills, you could make video recordings of them as they interacted with another student whom they are meeting for the first time. Then you could have two or more observers watch the videos and rate each student’s level of social skills. To the extent that each participant does, in fact, have some level of social skills that can be detected by an attentive observer, different observers’ ratings should be highly correlated with each other.
Validity
Validity, another key element of assessing measurement quality, is the extent to which the scores from a measure represent the variable they are intended to. But how do researchers make this judgment? We have already considered one factor that they take into account—reliability. When a measure has good test-retest reliability and internal consistency, researchers should be more confident that the scores represent what they are supposed to. There has to be more to it, however, because a measure can be extremely reliable but have no validity whatsoever. As an absurd example, imagine someone who believes that people’s index finger length reflects their self-esteem and therefore tries to measure self-esteem by holding a ruler up to people’s index fingers. Although this measure would have extremely good test-retest reliability, it would have absolutely no validity. The fact that one person’s index finger is a centimeter longer than another’s would indicate nothing about which one had higher self-esteem.
Discussions of validity usually divide it into several distinct “types.” But a good way to interpret these types is that they are other kinds of evidence—in addition to reliability—that should be taken into account when judging the validity of a measure.
Face validity
Face validity is the extent to which a measurement method appears “on its face” to measure the construct of interest. Most people would expect a self-esteem questionnaire to include items about whether they see themselves as a person of worth and whether they think they have good qualities. So a questionnaire that included these kinds of items would have good face validity. The finger-length method of measuring self-esteem, on the other hand, seems to have nothing to do with self-esteem and therefore has poor face validity. Although face validity can be assessed quantitatively—for example, by having a large sample of people rate a measure in terms of whether it appears to measure what it is intended to—it is usually assessed informally.
Face validity is at best a very weak kind of evidence that a measurement method is measuring what it is supposed to. One reason is that it is based on people’s intuitions about human behavior, which are frequently wrong. It is also the case that many established measures in psychology work quite well despite lacking face validity. The Minnesota Multiphasic Personality Inventory-2 (MMPI-2) measures many personality characteristics and disorders by having people decide whether each of over 567 different statements applies to them—where many of the statements do not have any obvious relationship to the construct that they measure. For example, the items “I enjoy detective or mystery stories” and “The sight of blood doesn’t frighten me or make me sick” both measure the suppression of aggression. In this case, it is not the participants’ literal answers to these questions that are of interest, but rather whether the pattern of the participants’ responses to a series of questions matches those of individuals who tend to suppress their aggression.
Content validity
Content validity is the extent to which a measure “covers” the construct of interest. For example, if a researcher conceptually defines test anxiety as involving both sympathetic nervous system activation (leading to nervous feelings) and negative thoughts, then his measure of test anxiety should include items about both nervous feelings and negative thoughts. Or consider that attitudes are usually defined as involving thoughts, feelings, and actions toward something. By this conceptual definition, a person has a positive attitude toward exercise to the extent that they think positive thoughts about exercising, feels good about exercising, and actually exercises. So to have good content validity, a measure of people’s attitudes toward exercise would have to reflect all three of these aspects. Like face validity, content validity is not usually assessed quantitatively. Instead, it is assessed by carefully checking the measurement method against the conceptual definition of the construct.
Criterion validity
Criterion validity is the extent to which people’s scores on a measure are correlated with other variables (known as criteria) that one would expect them to be correlated with. For example, people’s scores on a new measure of test anxiety should be negatively correlated with their performance on an important school exam. If it were found that people’s scores were in fact negatively correlated with their exam performance, then this would be a piece of evidence that these scores really represent people’s test anxiety. But if it were found that people scored equally well on the exam regardless of their test anxiety scores, then this would cast doubt on the validity of the measure.
A criterion can be any variable that one has reason to think should be correlated with the construct being measured, and there will usually be many of them. For example, one would expect test anxiety scores to be negatively correlated with exam performance and course grades and positively correlated with general anxiety and with blood pressure during an exam. Or imagine that a researcher develops a new measure of physical risk taking. People’s scores on this measure should be correlated with their participation in “extreme” activities such as snowboarding and rock climbing, the number of speeding tickets they have received, and even the number of broken bones they have had over the years. When the criterion is measured at the same time as the construct, criterion validity is referred to as concurrent validity; however, when the criterion is measured at some point in the future (after the construct has been measured), it is referred to as predictive validity (because scores on the measure have “predicted” a future outcome).
Discriminant validity
Discriminant validity, on the other hand, is the extent to which scores on a measure are not correlated with measures of variables that are conceptually distinct. For example, self-esteem is a general attitude toward the self that is fairly stable over time. It is not the same as mood, which is how good or bad one happens to be feeling right now. So people’s scores on a new measure of self-esteem should not be very highly correlated with their moods. If the new measure of self-esteem were highly correlated with a measure of mood, it could be argued that the new measure is not really measuring self-esteem; it is measuring mood instead.
Increasing the reliability and validity of measures
We have reviewed the types of errors and how to evaluate our measures based on reliability and validity considerations. However, what can we do while selecting or creating our tool so that we minimize the potential of errors? Many of our options were covered in our discussion about reliability and validity. Nevertheless, the following table provides a quick summary of things that you should do when creating or selecting a measurement tool.
| Item | Reflection items |
| Make sure that you engage in a rigorous literature review so that you understand the concept that you are studying. This means understanding the different ways that your concept may manifest itself. This review should include a search for existing instruments.[7] |
Note: If an instrument is standardized, that means it has been rigorously studied and tested. |
| Use content experts to review your instrument. This is a good way to check the face validity of your items. Additionally, content experts can also help you understand the content validity. [8] |
|
| Pilot test your instrument on a sufficient number of people and get detailed feedback. [9] Ask your group to provide feedback on the wording and clarity of items. Keep detailed notes and make adjustments BEFORE you administer your final tool. |
|
| Provide training for anyone helping to administer your tool. [10] You should provide those helping you with a written research protocol that explains all of the steps of the project. You should also problem solve and answer any questions that those helping you may have. This will increase the chances that your tool will be administered in a consistent manner. |
|
| When thinking of items, use a higher level of measurement, if possible. [11] This will provide more information. |
|
| Use multiple indicators for a variable. [12] Think about the number of items that you will include in your tool. |
|
| Conduct an item-by-item assessment of multiple-item measures. [13] When you do this assessment, think about each word and how it changes the meaning of your item. |
|
Key Takeaways
- In measurement, two types of errors can occur: systematic, which we might be able to predict, and random, which are difficult to predict but can sometimes be addressed during statistical analysis.
- There are two distinct criteria by which researchers evaluate their measures: reliability and validity. Reliability is consistency across time (test-retest reliability), across items (internal consistency), and across researchers (interrater reliability). Validity is the extent to which the scores actually represent the variable they are intended to.
- Validity is a judgment based on various types of evidence. The relevant evidence includes the measure’s reliability, whether it covers the construct of interest, and whether the scores it produces are correlated with other variables they are expected to be correlated with and not correlated with variables that are conceptually distinct.
- Once you have used a measure, you should reevaluate its reliability and validity based on your new data. Remember that the assessment of reliability and validity is an ongoing process.
Exercises
- Use the measurement tools you located in the previous exercise. Evaluate the reliability and validity of these tools. Hint: You will need to go into the literature to "research" these tools.
- Provide a clear statement regarding the reliability and validity of these tools. What strengths did you notice? What were the limitations?
- Think about your target population. Are there changes that need to be made in order for one of these tools to be appropriate for your population?
- If you decide to create your own tool, how will you assess its validity and reliability?
11.5 Ethical and social justice considerations for measurement
Learning Objectives
- Identify potential cultural, ethical, and social justice issues in measurement.
Just like with other parts of the research process, how we decide to measure what we are researching is influenced by our backgrounds, including our culture, implicit biases, and individual experiences. For me as a middle-class, cisgender white woman, the decisions I make about measurement will probably default to ones that make the most sense to me and others like me, and thus measure characteristics about us most accurately if I don't think carefully about it. There are major implications for research here because this could affect the validity of my measurements for other populations.
This doesn't mean that standardized scales or indices, for instance, won't work for diverse groups of people. What it means is that researchers must not ignore difference in deciding how to measure a variable in their research. Doing so may serve to push already marginalized people further into the margins of academic research and, consequently, social work intervention. Social work researchers, with our strong orientation toward celebrating difference and working for social justice, are obligated to keep this in mind for ourselves and encourage others to think about it in their research, too.
This involves reflecting on what we are measuring, how we are measuring, and why we are measuring. Do we have biases that impacted how we operationalized our concepts? Did we include stakeholders and gatekeepers in the development of our concepts? This can be a way to gain access to vulnerable populations. What feedback did we receive on our measurement process and how was it incorporated into our work? These are all questions we should ask as we are thinking about measurement. Further, engaging in this intentionally reflective process will help us maximize the chances that our measurement will be accurate and as free from bias as possible.
The NASW Code of Ethics discusses social work research and the importance of engaging in practices that do not harm participants. [14] This is especially important considering that many of the topics studied by social workers are those that are disproportionately experienced by marginalized and oppressed populations. Some of these populations have had negative experiences with the research process: historically, their stories have been viewed through lenses that reinforced the dominant culture's standpoint. Thus, when thinking about measurement in research projects, we must remember that the way in which concepts or constructs are measured will impact how marginalized or oppressed persons are viewed. It is important that social work researchers examine current tools to ensure appropriateness for their population(s). Sometimes this may require researchers to use or adapt existing tools. Other times, this may require researchers to develop completely new measures. In summary, the measurement protocols selected should be tailored and attentive to the experiences of the communities to be studied.
But it's not just about reflecting and identifying problems and biases in our measurement, operationalization, and conceptualization - what are we going to do about it? Consider this as you move through this book and become a more critical consumer of research. Sometimes there isn't something you can do in the immediate sense - the literature base at this moment just is what it is. But how does that inform what you will do later?
Key Takeaways
- Social work researchers must be attentive to personal and institutional biases in the measurement process that affect marginalized groups.
Exercises
- Think about your current research question and the tool(s) that you will use to gather data. Even if you haven't chosen your tools yet, think of some that you have encountered in the literature so far.
- What are the potential social justice considerations surrounding your methods?
- What are some strategies you could employ to ensure that you engage in ethical research?
- Milkie, M. A., & Warner, C. H. (2011). Classroom learning environments and the mental health of first grade children. Journal of Health and Social Behavior, 52, 4–22 ↵
- Kaplan, A. (1964). The conduct of inquiry: Methodology for behavioral science. San Francisco, CA: Chandler Publishing Company. ↵
- Earl Babbie offers a more detailed discussion of Kaplan’s work in his text. You can read it in: Babbie, E. (2010). The practice of social research (12th ed.). Belmont, CA: Wadsworth. ↵
- Likert, R. (1932). A technique for the measurement of attitudes. Archives of Psychology, 140, 1–55. ↵
- Engel, R. & Schutt, R. (2013). The practice of research in social work (3rd. ed.). Thousand Oaks, CA: SAGE. ↵
- Engel, R. & Shutt, R. (2013). The practice of research in social work (3rd. ed.). Thousand Oaks, CA: SAGE. ↵
- Sullivan G. M. (2011). A primer on the validity of assessment instruments. Journal of graduate medical education, 3(2), 119–120. doi:10.4300/JGME-D-11-00075.1 ↵
- Sullivan G. M. (2011). A primer on the validity of assessment instruments. Journal of graduate medical education, 3(2), 119–120. doi:10.4300/JGME-D-11-00075.1 ↵
- Engel, R. & Schutt, R. (2013). The practice of research in social work (3rd. ed.). Thousand Oaks, CA: SAGE. ↵
- Engel, R. & Schutt, R. (2013). The practice of research in social work (3rd. ed.). Thousand Oaks, CA: SAGE. ↵
- Engel, R. & Schutt, R. (2013). The practice of research in social work (3rd. ed.). Thousand Oaks, CA: SAGE. ↵
- Engel, R. & Schutt, R. (2013). The practice of research in social work (3rd. ed.). Thousand Oaks, CA: SAGE. ↵
- Engel, R. & Schutt, R. (2013). The practice of research in social work (3rd. ed.). Thousand Oaks, CA: SAGE. ↵
- https://www.socialworkers.org/about/ethics/code-of-ethics/code-of-ethics-english ↵
The process by which we describe and ascribe meaning to the key facts, concepts, or other phenomena that we are investigating.
In measurement, conditions that are easy to identify and verify through direct observation.
In measurement, conditions that are subtle and complex that we must use existing knowledge and intuition to define.
The process of determining how to measure a construct that cannot be directly observed
Conditions that are not directly observable and represent states of being, experiences, and ideas.
“a logical grouping of attributes that can be observed and measured and is expected to vary from person to person in a population” (Gillespie & Wagner, 2018, p. 9)
The level that describes the type of operations can be conducted with your data. There are four nominal, ordinal, interval, and ratio.
Level of measurement that follows nominal level. Has mutually exclusive categories and a hierarchy (order).
A higher level of measurement. Denoted by having mutually exclusive categories, a hierarchy (order), and equal spacing between values. This last item means that values may be added, subtracted, divided, and multiplied.
The highest level of measurement. Denoted by mutually exclusive categories, a hierarchy (order), values can be added, subtracted, multiplied, and divided, and the presence of an absolute zero.
variables whose values are organized into mutually exclusive groups but whose numerical values cannot be used in mathematical operations.
variables whose values are mutually exclusive and can be used in mathematical operations
The differerence between that value that we get when we measure something and the true value
Errors that are generally predictable.
Errors lack any perceptable pattern.
The ability of a measurement tool to measure a phenomenon the same way, time after time. Note: Reliability does not imply validity.
The extent to which scores obtained on a scale or other measure are consistent across time
The extent to which different observers are consistent in their assessment or rating of a particular characteristic or item.
The extent to which the scores from a measure represent the variable they are intended to.
The extent to which a measurement method appears “on its face” to measure the construct of interest
The extent to which a measure “covers” the construct of interest, i.e., it's comprehensiveness to measure the construct.
The extent to which people’s scores on a measure are correlated with other variables (known as criteria) that one would expect them to be correlated with.
A type of Criterion validity. Examines how well a tool provides the same scores as an already existing tool.
A type of criterion validity that examines how well your tool predicts a future criterion.
the group of people whose needs your study addresses
individuals or groups who have an interest in the outcome of the study you conduct
the people or organizations who control access to the population you want to study
