
Module 3. Petrology of Countertops
3.2 Countertop Data
Elizabeth A. Johnson; Sarah O'Reilly; and Eric Pyle
Data
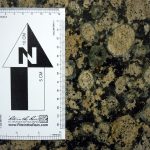
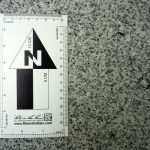
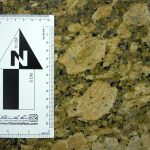
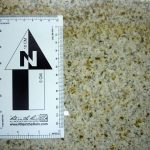
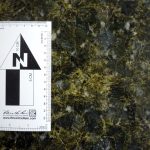
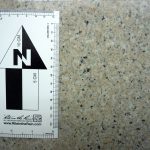
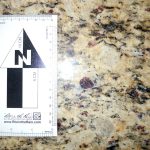
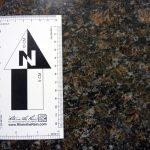
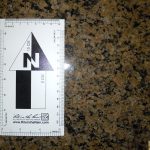
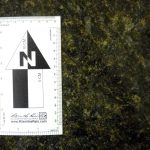
- Countertops are listed in alphabetical order in the table below. Click on the image to access all data and images available for that sample.
- Methods of collection for each type of data are reported at the bottom of this page.
- Whole-rock major and trace geochemical data compiled for all 10 samples can be found here: All_countertops geochem analyses
 |
 |
 |
 |
 |
 |
 |
 |
 |
 |
Analytical Methods
Whole-rock geochemistry:
Representative splits from extras of each countertop were sent to ALS Minerals for major and trace element analyses by ICP-AES analysis. See this EPA page for information about “granite” countertops: U and Th in countertops pose insignificant radon risk compared to levels in soil and bedrock. “… it is extremely unlikely that granite countertops in homes could increase the radiation dose above that the normal, natural background dose that comes from soil and rocks.”
Mineral assemblage:
Mineral assemblages for each countertop were assessed in three ways. Research student Sarah O’Reilly independently identified and described minerals she found within petrographic thin section using optical methods. These results were then compared to results from three semesters’ worth of projects from Liz Johnson’s Introduction to Petrology course. Accessory minerals and unknowns were also identified using EDS analyses using the electron microprobe at the USGS in Reston. Results were compiled into the modal abundance spreadsheets.
Modal abundance:
The modal abundance of major minerals within each rock was determined by point-counting. A scanned image of each thin section was printed, and a grid with spacing corresponding to 1.35 mm on the thin section was drawn to scale on the image. A total of 340-408 points were counted for each thin section on a petrographic microscope, using the gridded image as a guide.
Thin section images:
Images were obtained using an Epson Perfection V300 Photo scanner. Thin sections were sandwiched between two 2″ polarizer film squares to obtain cross-polarized images. Tips for using a scanner with petrographic thin sections and applications of this technique can be found in the following references:
Arpin, TL, Mallol, C & Goldberg, P. (2002) Short Contribution: A New Method of Analyzing and Documenting Micromorphological Thin Sections Using Flatbed Scanners: Applications in Geoarchaeological Studies. Geoarchaeology: An International Journal,17, 3, 305–313.
Choh, S-J & Milliken, KL. (2004) Virtual carbonate thin section using pdf: new method for interactive visualization and archiving. Carbonates and Evaporites, 19, 2, 87-92.
De Keyser, TL (1999) Digital scanning of thin sections and peels. Journal of Sedimentary Research, 69, 4, 962-964.
Philpotts, AR & Dickson, LD (2002) Millimeter-scale modal layering and the nature of the upper solidification zone in thick flood-basalt flows and other sheets of magma. Journal of Structural Geology, 24, 1171-1177.
Tarquini, S & Favalli, M. (2010) A microscope information system (MIS) for petrographic analysis. Computers & Geosciences, 36, 665-674.
Feldspar compositions from electron microprobe analyses
Feldspar compositions were obtained using the JEOL-8900 electron microprobe at the USGS in Reston. Analyses were obtained at 15 kV and 20 nA using a 5 micrometer defocused beam. Counting times were 20-60 sec on peak.
Media Attributions
- smBalticBrown © Elizabeth Johnson is licensed under a CC BY-NC-SA (Attribution NonCommercial ShareAlike) license
- smBethelAsh © Elizabeth Johnson is licensed under a CC BY-NC-SA (Attribution NonCommercial ShareAlike) license
- smGialloFiorito © Elizabeth Johnson is licensed under a CC BY-NC-SA (Attribution NonCommercial ShareAlike) license
- smGoldenLeaf © Elizabeth Johnson is licensed under a CC BY-NC-SA (Attribution NonCommercial ShareAlike) license
- smGreenButterfly © Elizabeth Johnson is licensed under a CC BY-NC-SA (Attribution NonCommercial ShareAlike) license
- smRainbowRed © Elizabeth Johnson is licensed under a CC BY-NC-SA (Attribution NonCommercial ShareAlike) license
- smSantaCecilia © Elizabeth Johnson is licensed under a CC BY-NC-SA (Attribution NonCommercial ShareAlike) license
- smTanBrown © Elizabeth Johnson is licensed under a CC BY-NC-SA (Attribution NonCommercial ShareAlike) license
- smTropical Brown © Elizabeth Johnson is licensed under a CC BY-NC-SA (Attribution NonCommercial ShareAlike) license
- smUbatuba © Elizabeth Johnson is licensed under a CC BY-NC-SA (Attribution NonCommercial ShareAlike) license
