
5 Biogeochemical cycles
Energy flows directionally through ecosystems, entering as sunlight (or inorganic molecules for chemoautotrophs) and leaving as heat during the many transfers between trophic levels. However, the matter that makes up living organisms is conserved and recycled. The six most common elements associated with organic molecules—carbon, nitrogen, hydrogen, oxygen, phosphorus, and sulfur—take a variety of chemical forms and may exist for long periods in the atmosphere, on land, in water, or beneath the Earth’s surface. Geologic processes, such as weathering, erosion, water drainage, and the subduction of the continental plates, all play a role in this recycling of materials. Because geology and chemistry have major roles in the study of this process, the recycling of inorganic matter and nutrients between living organisms and their environment (among atmosphere, oceans and lands) is called a biogeochemical cycle.
Mineral nutrients are cycled, either rapidly or slowly, through the entire biosphere, from one living organism to another, and between the biotic and abiotic world. Unfortunately, recent human activities have significantly altered the biogeochemical cycles. In this chapter, we will learn about carbon, nitrogen, and phosphorus cycles.
Introduction to Carbon Cycle
Processses that regulate the carbon cycle
The importance of the carbon cycle
After oxygen (O), Carbon (C) is the second most abundant element in living organisms. Carbon is present in all organic molecules, and its role in the structure of macromolecules is of primary importance to living organisms. Carbon compounds contain high energy (such as carbohydrates). Therefore, the movement of carbon (C) in ecosystems largely follows the same paths as the movement of energy.
Fossilized organisms (also called fossil fuel), mainly plants, have been utilized as a source of fuel by humans. Since the 1800s, the number of countries using massive amounts of fossil fuels has increased and the global demand for the Earth’s limited fossil fuel supplies has risen since the Industrial Revolution. As we learned in Part 1, the amount of carbon dioxide (CO2) in our atmosphere has increased in the recent decades. Such increase in carbon dioxide has been associated with climate change and other disturbances of the Earth’s ecosystems, which has become a major environmental concern worldwide. The concept of “carbon footprint” is based on how much carbon dioxide (and other C-compounds, e.g. methane- CH4) is produced via burning fossil fuel by a person, an area or a country. Carbon dioxide (and other greenshouse gases) is emitted via your daily activities, such as using eletricity, driving car and disposing waste. By calculating carbon footprint, we can evalute and compare our impacts (therefore called “footprint”) to our environment.
Watch the video Episode 1: Global Warming. It’s All About Carbon by Robert Krulwich and Odd Todd from National Public Radio (Standard YouTube License).
Biotic and abiotic reservoirs of carbon
The movement of carbon through land, water, and air is complex, and in many cases, it occurs more slowly geologically than the movement between living organisms. Carbon is stored for long periods in what are known as carbon reservoirs, which include the atmosphere, bodies of liquid water (mostly oceans), ocean sediments, soils, land sediments (including fossil fuels), and the Earth’s interior. The carbon cycle is most easily studied as two interconnected sub-cycles: one dealing with rapid carbon exchange among living organisms and the other dealing with the long-term cycling of carbon through geologic processes. The fast carbon cycle and reservoirs of the slow carbon cycle are shown in the diagram below.

This diagram of the fast carbon cycle shows the movement of carbon between land, atmosphere (left), and oceans (right). Yellow numbers are natural fluxes, and red are human contributions in gigatons of carbon per year. White numbers indicate stored carbon. Because the fluxes in the slow carbon cycle are so slow, they are not shown on this diagram. [Carbon cycle diagram. National Aeronautics and Space Administration (NASA) Earth Observatory. Diagram adapted from the U.S. Department of Education (DOE) Biological and Environmental Research Information System. Public Domain](Credit: Holli Riebeek)
As shown in the figure, the atmosphere is a major reservoir of carbon in the form of carbon dioxide (CO2) and is essential to the process of photosynthesis. The level of carbon dioxide in the atmosphere is influenced by the reservoir of carbon in the oceans. The exchange of carbon between the atmosphere and water reservoirs influences how much carbon is found in each location, and each one affects the other reciprocally.
Seven processes that drive the carbon cycle
1. Photosynthesis
When performing photosynthesis, most terrestrial autotrophs obtain their carbon dioxide directly from the atmosphere, while marine autotrophs acquire it in the dissolved form (carbonic acid, H2CO32-). As carbon dioxide (and water) is acquired for photosynthesis, the products of the process are oxygen (O2) and sugar (C6H12O6) for energy. The photosynthetic organisms are responsible for depositing the approximately 21 percent oxygen content of the atmosphere that we observe today. The figure below shows a simple schematic of the materials moving into and out of a leaf during photosynthesis along with the equation for photosynthesis on the right (Image credit: Vojtech.dostal, Wikimedia commons

2. Respiration (by all living organisms)
During cellular respiration, living organisms break down organic carbon compounds to produce energy (such as ATP) and CO2 and water are released as by-products. The most efficient type of respiration, aerobic respiration, requires oxygen obtained from the atmosphere or dissolved in water. Thus, there is a constant exchange of oxygen and carbon dioxide between autotrophs (which need carbon) and heterotrophs (which need oxygen). Gas exchange through the atmosphere and water is one way that the carbon cycle connects all living organisms on Earth.
3. Consumption
Living organisms are connected in many ways. A good example of this connection is the exchange of carbon between autotrophs and heterotrophs and between different heterotrophs by way of organic carbon compounds. Most autotrophs use carbon dioxide to build multi-carbon, high energy organic compounds, such as glucose. The energy harnessed from the sun is used by producers to form the covalent bonds that link carbon atoms together. The bonds in long carbon chains contain chemical energy. When the chains break apart, the stored energy is released for later use in the process of cellular respiration or tissue production.
Autotrophs and heterotrophs (especially the primary consumers, largely herbivores are partners in biological carbon exchange. Heterotrophs acquire high-energy carbon compounds from the autotrophs by consuming them, and breaking them down through respiration to obtain cellular energy, such as ATP (Figure 16.5).

Herbivores, like this mule deer (left) and monarch caterpillar (right), eat primarily plant material. The process of consumption by herbivores transfers the chemcal energy stored in producers (plants) into the chemical energy (as organic carbon compounds) in the heterotrophs. The energy is used later for cellular respiration and secondary production (credit left: modification of work by Bill Ebbesen; credit right: modification of work by Doug Bowman)
4. Gas exchange between oceans and atmosphere
As stated previously, gas exchange of carbon between the atmosphere and water reservoirs can affect carbon fluxes and carbon storage at each location. For example, an increased level of carbon dioxide in the atmosphere can greatly change the reservoir of carbon in the oceans. Atmospheric carbon dioxide (CO2) dissolves in water and combines with water molecules to form carbonic acid (H2CO32-), and then it ionizes to carbonate (CO32-) and bicarbonate ions (HCO3–) as shown in the figure below (Solubility carbon pump. Credit: NOC/V.Byfield. The National Archives UK. Open Government License (OGL)]). Naturally, such atmosphere-ocean carbon exchange occurs in both directions at a similar magnitude. There is often little net transfer over time. Some of the carbon dioxide that is diffused in the oceans can be used either by plants and phytoplankton for photosynthesis, or converted into carbonate and bicarbonate ions. Such surface ocean-atmosphere CO2 gas exchange occurs at a relatively short time scale. Most of the anthropogenic carbon released in the past decades are taken up by the ocean and stored in the deep ocean as sediments for a long time.

5. Sedimentation / Burial
Sedimentation and burial are largely processes in the slow carbon cycle. Carbon dioxide in the atmosphere is dissolved in rainfall to form a weak acidic solution, which dissolves minute amounts of rock when it hits the ground. This process, called chemical weathering releases more carbon and ions like calcium and sodium which are then carried to the ocean. Once in the ocean, carbon, oxygen and calcium bond to form calcium carbonate (CaCO3) in animal shells and coral skeletons. When these animals die, the shells and skeletons sink to the bottom of the ocean and can be buried. Over time, as more and more layers of shells and skeletons build up, these particles become cemented together to become rocks like limestone. About 80% of the carbon stored in rocks in stored this way. The other 20% comes from organic matter, like leaves, getting buried in mud and other organic matter faster than it can decompose. With time and pressure, this organic matter and the surrounding mud forms sedimentary rocks like shale and some is converted to fossil fuels (as shown below). The deposition of the carbon material, whether it is shells, skeletons of organic matter, is called sedimentation. The deposition of additional material on top is called burial. When carbon is burried as organic matter before it is fully decomposed, some of it The transformation of these materials into rock is called lithification. Carbon stored in the sediment can be returned to the atmosphere through volcanoes to begin the carbon cycle again. Moving from atmosphere to ocean to rock and back to atmosphere takes 100-200 million years.


The diagrams above describe how coal (top), and petroleum and natural gas (bottom) are formed during the burial and geological processes. (Formation of Fossil Fuels. Originally uploaded in EarthLabs: Climate and the Carbon Cycle . U.S. Department of Energy National Science Foundation (NSF) Public Domain)
6. Decomposition
The process where dead organic matter (dead animals and dead plants) and organic substances are broken down into simple inorganic carbon forms is called decomposition. In this process, carbon in the organic matter is converted into inorganic carbon dioxide gas, which is released back to atmosphere. Decomposition relies on cellular respiration of bacteria and fungi (decomposers); therefore it is related to rates of microbial respiration.
7. Combustion
The combustion of organic matter and/or fossil fuels releases CO2 back into the atmosphere. Some combustion is natural, like natural fires occurring in forests and grasslands. Other combustion is caused by human activities. Anthropogenic combustion has altered the carbon cycle in the past 2 centuries. For example, forest fires are a natural occurence, but human management has increased the frequency of fires in some areas. In addition, human burning of fossil fuels introduces almost 10 to 100 times as much carbon per year to the atmosphere(about 1015 grams) as the slow carbon cycle (1013 to 1014 per year). Human alteration to the global carbon cycle is discussed further below.
For more explanation, watch this video “The Carbon Cycle” by the U.S. Environmental Protection Agency.

Human activities that alter and disrupt the carbon cycle
Extraction and combustion of fossil fuel
Over the past two centuries, extraction and combustion of fossil fuels (e.g., coal, oil, natural gas) has increased to meet energy demands. However, the combustion of fossil fuels releases a large amount of CO2 into the atmosphere. CO2 is a greenhouse gas that absorbs infrared radiation. Excessive amounts of CO2 have caused our planet to become much warmer than it has been in a very long time and have altered patterns of precipitation, as discussed in the unit on climate change. In brief, many studies indicate that current CO2 levels in our atmosphere fluctuate greatly have risen since the Industrial Revolution (see the blue graph below). During the same time, the mean temperature of the Earth has increased by about 0.8°C (see the red graph below). (Graphs by Robert Simmon, using CO2 data from the NOAA Earth System Research Laboratory and temperature data from the Goddard Institute for Space Studies.)(Image source: NASA’s Earth Observatory)

Importantly, carbon dioxide released from one particular area does not stay in the same area. Watch the NASA’s video “A Year in the Life of Earth’s CO2” to learn about global CO2 distribution on the earth and answer the following questions.
Deforestation
In the past several decades, humans have cleared forests to make land available for other uses including urban development and agriculture. The process of deforestation not only releases CO2 from burning during clearing and the decomposition process of debris, but also reduces the amount of atmospheric CO2 that can be absorbed by plants for photosynthesis by removing the vegetation. Time series of satellite data, like the imagery available from the Landsat satellites, allow scientists to monitor changes in forest cover. Deforestation can release carbon dioxide into the atmosphere, while forest regrowth removes CO2. The pair of false-color images below shows clear-cutting and forest regrowth between 1984 and 2010 in Washington State, northeast of Mount Rainier. Dark green corresponds to mature forests, red indicates bare ground or dead plant material (freshly cut areas), and light green indicates relatively new growth. (NASA image by Robert Simmon, using Landsat data from the USGS Global Visualization Viewer.)

Introduction to the Nitrogen Cycle

Nitrogen is essential to every living cell. In the atmosphere, nitrogen makes up 78% of the gas molecules by volume (as in forms of N2 gas). Yet, most of animals and plants are not capable to access the nitrogen gas (unreactive) due the extradinary stability of the triple bond between the two nitrogen atoms. For hundrds of years humans have been limited to access fixed nitrogen until two German chemists Fritz Haber (shown on the left in the image above, credit: The Nobel Foundation, 1919) and Carl Bosch invented the Haber-Bosch process, an artificial nitrogen fixation process. The Haber-Bosch process is typically conducted with both nitrogen and hydrogen gases continuously passed through beds of catalyst under high pressure (15 – 25 MPa; equivalent to 2,200–3,600 psi) and high temperatures between 400–500 °C (752–932 °F) to produce ammonia gas (NH3). The apparatus invented by Haber to create ammonia gas for the first time is shown on the right in the image above (Credit: JGvBerkel). Haber and Bosch were later awarded Nobel prizes in 1918 and 1931, respectively, for their invention of Haber-Bosch process.
The Haber-Bosch process made the production of chemical fertilizers possible. As the world’s human population continued to grow rapidly in the early 20th century, the usage of fertilizers was urgently needed to provide better crop yield. The Haber-Bosch process provides a solution to “fix” unreactive nitrogen, which converts nitrogen from an inactive gas in the air to nitrogen compounds that would be further used to produce fertilizers for promoting crop yields. The Haber-Bosch process has changed how nitrogen fertilizers are produced and used in the modern society. It played a significant role and contributed to the success of the “Green Revolution” of the 20th century.
The Nitrogen (N) cycle
Nitrogen (N) is an important component to all life. Nitrogen makes up amino acids, which are the building blocks of protein and nucleic acids (i.e. DNA and RNA). Nitrogen in the atmosphere (or in the soil) can go through many complex chemical and biological changes to be combined into living and non-living materials. This is called the nitrogen cycle.
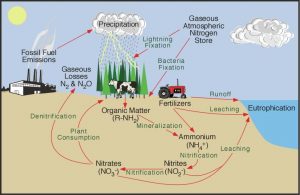
The largest abiotic reservior of nitrogen is the atmosphere. The atmosphere is 78 percent nitrogen gas (N2), which is colorless, odorless, and nontoxic. However, getting this nitrogen into the living world is difficult. Plants and phytoplankton are not equipped to incorporate nitrogen gas from the atmosphere. Nitrogen gas exists as tightly bonded with a triple covalent bond, which is very hard to break. Because of this, many plants live in a world surrounded by nitrogen, but their growth is still limited by a lack of nitrogen they can use. Nitrogen moves through different abiotic and biotic reservoirs via five major processes (as shown below, credit: NOAA https://cpo.noaa.gov/Meet-the-Divisions/Earth-System-Science-and-Modeling/AC4/Improved-understanding-of-nitrogen-cycle). We will discuss each of these processes further.
Six processes that regulate the nitrogen cycle
Nitrogen fixation
Although 78 percent of atmospheric gas is nitrogen gas (N2), most living organisms (including plants) cannot utilize nitrogen gas. Nitrogen enters the living world via bacteria, which incorporate nitrogen into their macromolecules (large molecules like carbohydrates and proteins) through nitrogen fixation. Biological nitrogen fixation is very energy-intensive process in which atmospheric nitrogen (N2) is converted into forms that primary producers can use, including ammonia (NH3) which is rapidly converted into ammonium (NH4+) in the presence of water. This ammonium “sticks” to clay particles in the soil because the clay particles generally have a negative charge. The ammonium can be taken up by plants or transformed further.
Nitrogen fixation can also occur when lightning, wildfires or combustion of fossil fuels converts nitrogen gas (N2) into nitrate (NO3–). Some nitrogen-fixing bacteria is found living in the root nodules of legumes, such as peanuts, and other plants. The plants provide sugar (from photosynthesis) to the bacteria and the bacteria provide nitrogen in a form the plant can use.
Nitrification
Nitrification is an important process in the nitrogen cycle, which can occur in soils, aquatic ecosystems, and wastewater treatment systems. During the nitrification process, ammonia (NH3) is converted to nitrate (NO3–) through biological processes.
Nitrification is performed by two functionally defined groups of microbes (including bacteria and archaea), referred to together as nitrifiers.
The first functional group of nitrifiers is the ammonia oxidizers, which oxidize ammonium (NH3) to nitrite (NO2–). Most bacteria that oxidize ammonia under aerobic conditions are chemoautotrophs and use the small amount of energy produced in these reactions to convert carbon dioxide into sugars.
NH3 
 NO2
NO2
In particular, there are two main groups of bacteria: Nitrosomonas and Nitrosococcus bacteria, involved in this process, but recently, some species of Archaea, a group of organisms that are similar to bacteria but with structural and genetic differences, have been found to also oxidize ammonia.
The second functional group of nitrifying microbes is the nitrite-oxidizing bacteria, which convert nitrite (NO2–) to nitrate (NO3–).
NO2 – NO3 –
The best-known cultivated members in this group are the Nitrobacter and Nitrococcus bacteria. These bacteria also derive a small amount of energy from this reaction, which they use to convert CO2 into sugars. Because the energy released in this reaction is so small, the growth rate for these bacteria is also very small.
The overall chemical reactions involved in the nitrification process are summarized below.
NH4 + NO2 –NO3 –
Nitrate is also one of the nitrogen sources for many plant and algal groups and can be easily assimilated by producers. In contrast to ammonium, nitrate is more easily leached in the soil solution. Thus, nitrification can potentially reduce the efficiency of fertilizer application because the nitrogen can more easily be carried through the soil by water (leaching). Nitrate is also the substrate of the denitrification process (A process that returns fixed nitrogen compounds in the ecosystem back to inactive nitrogen gas in the atmosphere.). Nitrification process plays a critical role in the balance of nitrogen cycle.
Traditionally, scientists thought that all nitrification occurred in aerobic conditions, parts of the soil with oxygen, usually relatively near the surface. In 1999, scientists discovered another process anammox (anaerobic ammonia oxidation), which, as the name states, occurs in anaerobic conditions. This process was first discovered in wastewater treatment plants (where sewage is treated) but has since been discovered in a lot of aquatic systems. Because nitrification is a necessary step before denitrification, which returns nitrogen to the atmosphere, annamox may be an important process in nitrogen loss from aquatic systems.
Denitrification
During denitrification, nitrates (NO3 –) in the soil or sediment (basically soil in an aquatic system) are converted into dinitrogen gas (N2) and released back into atmosphere. The first main step, from nitrate to nitric oxide (NO) is accomplished by several groups of bacteria (e.g., Pseudomonas denitrificans) under anaerobic conditions. The denitrification process is important for a number of reasons. In agricultural systems, denitrification removes inorganic, plant-available nitrogen and returns it to the atmosphere, representing a decrease in effectiveness of fertilization. In wastewater treatment, denitrification is an important step because it decreases the amount of nitrogen that is discharged to surface waters. In addition, some of the intermediate products of denitrification are greenhouse gases.
Nitrate can also be converted into ammonium, through a process called dissimilatory nitrate reduction to ammonium (DNRA). DNRA is a particularly important process in low-oxygen marine ecosystems because it occurs in anaerobic conditions. It does not remove nitrate from the system, but instead converts it into another form useable for plants.
Assimilation
Assimilation is the process when primary producers take up inorganic NH4+ or NO3– from the soil, and incorporate it into their plant tissues as organic N compounds (such as amino acids, proteins and other N-containing compounds). Primary consumers assimilate nitrogen from primary producers and then excrete it as waste via metabolic processes.
The available supply of inorganic nitrogen to producers in the ecosystem is critical to the study of ecoysystem dynamics. Just as the amount of energy available in an ecosystem can limit the populations of higher trophic levels, the amount of nitrogen available often limits the growth of primary producers and therefore higher trophic levels.
The inorganic nitrogen (ammonia and nitrate) that is assimilated by plants is successively converted into organic nitrogen. This organic nitrogen is then returned to the atmosphere as nitrogen gas by three processes in terrestrial systems: mineralization (described below) then nitrification and denitrification.
Mineralization
Consumers’ nitrogenous waste and dead tissues of animals and plants are consumed and broken down by scavengers and detritivores first and further decomposed by bacterial and fungi (decomposers). Mineralization is the process of breaking down organic nitrogen compounds into inorganic nitrogen compounds (NH4+ or NO3– ) by decomposers (i.e. bacteria and fungi) and releasing the nitrogen back to soils.
Human activities that alter and impact global nitrogen cycle
Human activities release nitrogen into the environment by two primary means: (1) the use of artificial fertilizers in agriculture, which are then washed into lakes, streams, and rivers by surface runoff; (2) the usage and combustion of fossil fuels, which releases different nitrogen oxides to the atmosphere. Fertilizer runoff is a major contributor to eutrophication. As described at the start of this section, the technology of manufacturing nitrogen-containing fertilizer by fixing atmospheric nitrogen gas was first developed by German chemists, Fritz Haber and Carl Bosch, during World War I. It is called Haber-Bosch process.
You can also listen to Radiolab podcast episide: “How do you solve a probelm like Fritz Haber?” to learn more about Fritz Haber.
The amount of fertilizer application is strongly correlated to growth of human population. The amount of industrially nitrogen-containing fertilizers applied to agricultural lands during 1980-1990 was more than all industrial fertilizers applied previously in human history. Approximately 100 million metric tons of nitrogen is fixed each year in the form of N fertilizers. Farmers also plant nitrogen-fixing crops to enhance soil nitrogen fertility. An estimated 40 million metric tons of N (ranges from 32-53 million metric tons) may be fixed annually by N-fixing agricultural and pastoral systems (e.g., soybeans, peas, beans, alfalfa, and rice paddies), which is not a part of natural N-fixation process (as shown below, Fields, 2004).

This chart above indicates the application of chemical fertilizers is strongly correlated to global human population growth. The input of total reactive nitrogen is contributed by industrial nitrogen fixation (fertilizer production), nitrogen fixing crop plants and fossil fuel combustion. (Image source: Environmental Health Prospect, 2004)
The excess nitrogen fertilizer input (along with excess phosphorus) to terrestrial ecosystems has caused the leaching and runoff of nitrogen (and phosphorus) into aquatic ecosystems and resulted in eutrophication. Eutrophication is a process where nutrient runoff causes the excess growth of microorganisms (mainly algae).

The overgrown algal populations block sunlight, deplete dissolved oxygen levels and indirectly kill other flora and fauna in the aquatic ecosystems. Nitrogen fertilizer runoff contributes to the formation of algal blooms such as the red tide bloom in the image at left, which extended more than 100 miles along Florida’s Gulf coastline in 2001. Such blooms kill thousands of fish and threaten human health. (Image source: Fields, Environmental Health Prospect, 2004)
b. Agricutural managment and fossil fuel combustion
There are an estimated 20 million metric tons of nitrogen in the form of NOx (i.e. both NO and NO2; NO- nitric oxide and NO2 – nitrogen dioxide) and nitrous oxide (N2O) released annually by high temperature combustion of fossil fuels from automobiles, factories, power plants, etc.
The NOx and N2O are derived from both the old N stored in fossil fuels or newly fixed nitrogen from the atmosphere.
The release of NOx and N2O into atmosphere can cause:
1. Thinning stratospheric ozone and forming tropopsheric ozone
Ozone (O3) exists at a very low concentration in our atmosphere (about three molecules of ozone for every 10 million air molecules). Despite this small amount, ozone plays a vital role in the atmosphere. Ninety per cent of ozone resides in the stratosphere layer, which extends between 10 – 17 kilometers above the Earth’s surface and up to about 50 kilometers. The remaining 10% of ozone is located in the troposphere, which is the lower region of the atmosphere (10 – 17 km above the Earth’s surface). Stratospheric ozone absorbs most of the damaging ultraviolet sunlight (i.e. UV-B) to only allow a small amount to reach the Earth’s surface. Therefore, stratospheric ozone protects living organisms from the harmful impacts of excessive exposure to UV-B radiation. The diagram below shows how the ozone is distributed between stratosphere and troposphere layers. The ozone in stratosphere layer is often called “good ozone”, because it prevents the damage of ultraviolet sunlight to living organisms on Earth by absorbing most of ultraviolet sunlight before it can reach the Earth’s surface. However, the ozone formed in the troposphere is “bad ozone” due to it is one of the greenhouse gases (GHG) and its major contribution to the formation of smog. (Image source: The Field Museum, Chicago)

NOx triggers a chemical reaction to break down “good” ozone. One oxygen atom (O) and one ozone molecule (O3) are broken down to two oxygen gas molecules (O2) with NOx molecules involved but not used. This means that this ozone catalytic cycle can repeat many times as long as NOx (derived naturally or anthropogenically) is available in the stratosphere for reaction. The release of NOx into the stratopshere can significantly remove ozone from the stratosphere, therefore expose living organisms to excess UV-B radiation.
The formation of “bad” ozone in troposphere
Low concentration of ozone occurs naturally in troposphere. Two natural sources of troposphere ozone are (1) released by plants and soil and (2) small amount of ozone migrated from stratopshere. The naturally occurred tropopshere ozone is not considered as a threat to human health and our enviornment due to its neglectable amount. However, tropospheric ozone has increased due to certain human activities. When sunlight (particulaly ultraviolet light), hydorcarbons and nitrogen oxides (NOx) emitted from automobiles, refineries and fossil fuel power plants interacts, it has doubled the ozone in the troposphere since 1900.
When tropospheric ozone reaches high levels and cause smog pollution (Smog is the air pollution that is composed of many air pollutants, including nitrogen oxides, sulphur oxides, ozone, smoke or other particulates (such as carbon monoxide and CFC), it could pose a threat to people with respiratory problems, tissue decay and other healthy issues. That’s why the tropospheric ozone is called “bad ozone” (Figure 17.9).
2. Global warming (N2O is one of the greenhouse gases.)
The atmospheric concentration of nitrous oxide (N2O) has been reported to be increasing in the past decades. Increased nitric oxide in the atmosphere has led to concern because it is one of the greenhouse gases. Nitrous oxide is naturally present in the atmosphere as part of global nitrogen cycle. However, many human sources, such as agriculture, fossil fuel combustion and industrial processes, have increased atmospheric nitrous oxide concentrations (ca. 40% of global total N2O emission) in the past decades. The pie chart below shows the sources of nitrous oxide (N2O) emission in the United States. All emission estimates from the U.S. Greenhouse Gas Emissions and Sinks: 1990-2015. (Credit: United States Environmental Protection Agency)
Agricultural management and practices are the largest source of N2O emissions in the United States. It accounts for 75 percent of total U.S. N2O emissions in 2015. Five percent of nitrous oxide is also emitted from livestock manure and urine. Nitrous oxide is also emitted when burning fossil fuel. The type of fuel and combustion technology and practice can affect the amount of N2O emitted from the combustion. During the industrial processes to produce synthetic commercial fertilizers, nylon and other synthetic products, nitrous oxide is also generated as a byproduct.

Nitrous oxide is a powerful greenhouse gas with a global warming potential of 298 times that of carbon dioxide (CO2), which means the impact of 1 pound of N2O on warming the atmosphere is 298 times that of 1 pound of carbon dioxide. Because of the emission control standards for vehicles and mobiles, nitrous oxide emissions in the United States have decreased by about 7 percent between 1990 and 2015. This is contributed to a decreased emission from mobile combustion, however, nitrous oxide emissions from agricultural sources were only about 2 percent lower in 2015 than in 1990.
3. Air pollution and acid precipitation
Acid rain is partially caused by nitrogen oxides (NOx) and sulfur dioxide (SO2) in the atmosphere that is transported by wind and air currents. The atmospheric NOx (and SO2) can form nitric acids and sulfuric acids, respectively, when reacting with water, oxygen and other chemicals in the atmosphere before falling to the ground. Even though natural sources (such as volcanic eruption) contribute some NOx into the atmosphere, the majority of NO comes from human activities.
The major of NOx in the atmosphere are derived from burning of fossil fuels (for generating electricity) and fuel emission from vehicles and heavy equipment, manufacturing, oil refineries and other industries. The image below illustrates the pathway for acid rain in the environment: (1) Emission of SO2 and NOx are released into the air, where (2) the pollutants are transformed into acid particles that may be transported long distances. (3) These acid particles then fall to the earth as wet and dry deposition (dust, rain, snow, etc.) and (4) may cause harmful effects on soil, forests, streams and lakes. (Image source: Acid Rain Pathway by United States Environmental Protection Agency)

Introduction to Phosphorus Cycle
Both phosphorus and nitrogen are essential nutrients for the plants and animals that make up terrestrial and aquatic food webs. In particular, phosphorus is in short supply in many fresh waters and coastal marine ecosystems. While an insufficient phosphorus supply can cause stress to plants and vegetation, with a modest amount of increase in phosphorus can accelerate phytoplankton growth (algal blooms). Such algae overgrowth could result in reduced water clarity, water quality and limited light penetration. The die-offs of dense algal blooms can speed up microbial decomposition to deplete dissolved oxygen in the water and create “dead zone” in the aquatic ecosystems. A lack of sufficient dissolved oxgyen causes the death of many fish, invertebrates, and other aquatic organisms. Dead zones are found in many freshwater lakes, for example, the central basin of Lake Erie of the Great Lakes in the United States.
There are natural and anthropogenic sources for phosphorus. The natual sources include phosphorus stored in soils and rocks. However, many sources of phosphorus are derived from human activities, including failing wastewater treatment plants and septic systems and runoff from fertilized cropland and animal manure storage areas. In this section, we will learn about the geochemical processes that regulate the global phosphorus cycle and further discuss the impacts of human activities on the global phosphorus cycle.
The Phosphorus (P) Cycle
Phosphorus (P) is an essential nutrient for living organisms and all living processes. It is a major component of nucleic acids (DNA and RNA), ATPs and phospholipids on cell memebranes. As calcium phosphate (CaPO43-), phosphorus also makes up supportive components of our bones. Phosphorus is often the limiting nutrient (A limiting nutrient here implies that the nutrient may be difficult for a plant to acquire, and therefore it becomes the only nutrient that is limiting the plant’s growth.) in aquatic ecosystems, because its low concentration of dissolved phase in fresh water and marine ecosystem. Unlike carbon and nitrogen, phosphorus does not have a gas phase, and it can only enter the atmosphere in the form of dust. Phosphorus occurs in nature and moves in the form of phosphate ion (PO43-). Due to the short supply of phosphate in nature, the vast majority of phosphorus compounds in the rocks and sediments are extracted for the production of fertilizers to promote plant growth.
18.1 Five processes that regulate the global phosphorus cycle
Phosphorus is released through natural surface runoff when leaching from phosphate-containing rock (a process called weathering). The leached phosphorus, thus, is drained into fresh water ecosystems (including rivers and lakes) and the ocean. The phosphate-containing rock has its origins in the ocean, which is formed primarily by the bodies and excretions of ocean organisms and from inorganic sediments. However, in remote regions, volcanic ash, aerosols, and mineral dust may also be the significant phosphate sources. The sediment deposited at the bottom of the ocean then is uplifted and become land areas of the Earth’s surface over geologic time (tectonic lifting). Phosphorus is also reciprocally exchanged between dissolved phosphate in the ocean and organic phosphate stored in the food webs of marine ecosystems (Figure 18.2). The movement of phosphate from the ocean to the land and through the soil is extremely slow, with an average oceanic residence time between 20,000 and 100,000 years.

In nature, phosphorus exists as the phosphate ion (PO43−). Weathering of rocks and volcanic activity releases phosphate into the soil, water, and air, where it becomes available to terrestrial food webs. Phosphate enters the oceans via surface runoff, groundwater flow, and river flow. Phosphate dissolved in ocean water cycles into marine food webs. Some phosphate from the marine food webs falls to the ocean floor, where it forms sediment. (credit: modification of work by John M. Evans and Howard Perlman, USGS)
We will discuss the following five major processess that regulate global phosphorus cycle.
1. Tectonic lifting:
Tectonic lifting is the uplifting process of the phosphate rocks (such as metamorphic, sedimentary, and igneous rocks) slowly by geological forces to become land surface and mountains. It marks the beginning of the global phosphorus cycle. Rates of tectonic lifting can range from zero to approximately 8 meter per thousand years (Buendía et al. 2010)
2. Weathering:
During the process of soil development, phosphorus in the uplifted rocks can be broken down and released into soils, a process called weathering. The phosphorus-containing rocks can be physically and chemically weathered by wind and rain (abiotic force), as well as penetration of plant roots and activities of other living organisms (biotic force). The weathering process requires water (H2O) and carbon dioxide (CO2). Carbon dioxide is normally existed in sufficient concentations in the soil environment. Therefore, rates of weathering reactions are strongly depending on the availability of water (soil moisture) and other factors, including annual temperature and content and structure of weathering materials (Buendia et al. 2010). The weathering process contributes phosphate ions into the lands and terrestrial ecosystems. Phosphate eventually makes it back to the ocean via surface runoff and leaching.
3. Assimilation
Assimilation is the process that occurs when primary producers (i.e. plants and algae) take up phosphate (PO43-) and incorporate it into their living tissues. It also includes when consumers assimilate phosphorus from primary producers or their preys. Some of phosphorus that is not assimilated into living tissue will be excreted as waste. Some plant species have a long-term established symbiotic relationship with mycorrhizae (one type of fungi), especially in ecosystems with low supply of phosphorus. Because phosphate in the rock normally hold the phosphorus in very insoluble forms, the ability of mycorrhizal fungus to produce organic acids can help release some soluble phosphorus and make it availability for plants. Mycorrhizal fungi help locate and absorb phosphate ions in the soil for their host plants, which they receive carbonhydrate (such as glucose and sucrose) as energy sources in return.
4. Mineralization:
The mineralization is the process that organic phosphorus compounds in the living organisms are converted into inorganic phosphate ions (PO43-) by the decomposers, which then released back to soils for plants to use. Phosphorus compounds from animal excretion of urine and dead animal/plant tissues are consumed and broken down by scavengers and detritivores first, then organic phosphorus compounds are later converted to inorganic PO43- ions by phosphatizing bacteria and fungi (decomposers).
5. Precipitation:
Phosphorus loss from terrestrial ecosystems is often through land surface runoff and erosion, drainage, fire, and artificial removal due to human activities (mining). When available inorganic phosphorus can react with dissolved minerals (such as iron, aluminum, manganese, or calcium) to form phosphate minerals that are not avaiable to plant uptake, it is called precipitation. In oxygenated waters, phosphorus precipitates after binding with calcium and iron [e.g., calcium phosphate, Ca(H2PO4)2]. While under the low-oxygen condition, dissolved iron binds with sulfur instead of phosphorus, making phosphorus more available to plants.
18.2 Human activities that alter and impact the global phosphorus cycle
1. Phosphate mining for production of fertilizer:
There is no atmospheric stage for the phosphorus cycle. Therefore, rock phosphate is mined from naturally occurring deposits for fertilizer production, animal feeds, and agricultural crops. Phosphate is usually found in shallow, near shore marine environments due to accumulation in ocean sediments / reefs and flushing from river systems into bays.
The largest known deposit of phosphorus in the United States is in Bone Valley, Florida. The Bone Valley Formation is a geologic formation in Florida, which contains economically important phosphorite deposits in west-central Florida, as well as rich assemblages of vertebrate fossils. At the current rate of consumption, the supply of phosphorus is estimated to run out in 345 years.
2. Eutrophication and dead zones
The practice of phosphorous mining has increased the amount of phosphorus released into the soils. When excess phosphorus (and nitrogen) (drained from fertilizer runoff and sewage) enters the aquatic ecosystems, it causes harmful effects to the ecosystem, i.e. eutrophicatio. Eutrophication is the process where excess phosphorous and nitrates contribute to an increase in productivity of phytoplankton populations (mostly algae), leading to excessive growth of microorganisms within aquatic systems. The photo below shows the eutrophication in Lake Dora, Florida, which is covered in algal blooms. (Image credit: Nation Ocean Service. National Oceanic and Atmospheric Administration, U.S. Department of Commerce.). Eutrophication is discussed in more detail in the introduction to this part of the textbook.

Connection: Nutrient loading in Lake Erie (Great Lakes Area)
Part of the earth’s largest surface freshwater system, Lake Erie is a vital source of drinking water for 11 million people. Researchers Anna Michalak, Tom Bridgeman, and Pete Richards are studying how farming practices and severe weather can increase the amount of fertilizer-derived nutrients in the water, which diminishes water quality and threatens the lake’s ecosystem and the public’s health. (Video source: National Science Fundation)
Watch the video: Nutrient Loading In Lake Erie for better understanding the mechanisms and consequence of eutrophication caused by human activities.

Connection: Eutrophication in Atlanta, Georgia Area
Eutrophication has been a serious problem in the Atlanta, Georgia area. West Point Lake, which is south of the city, is the major lake that receives Atlanta’s waste water. Sources of phosphorus pollution in the West Point Lake include mainly point sources, primarily from waste water treatment facilitiesin metorpolitan Atlanta. West Point Lake had been observed with excess algal growth. From the 1940s to 1990s, household detergents contained phosphates in order to improve their cleaning effectiveness. However, these phosphates travelled into natural systems through wastewater and contributed to eutrophication and dead zones described above.
The chart below (Figure 18.8) shows the measurement of the amount of phosphorus (in tons per year) in upstream and downstream of the Chattahoochee River at Atlanta (Chattahoochee River is a major source of the water supply for Atlanta area.). Since 1990s, state laws has installed voluntary and mandatory restrictions on phosphorus detergents in the city to restrict phosphorus released from wastewater-treatment facilities. Most of household detergents now are phosphate-free! The amounts of phosphorus downstream of the city have decreased about 77% from the highest levels in 1984. It has caused large reductions in the amounts of phosphorus in the Chattahoochee River south of Atlanta, Georgia and in West Point Lake. Although, the total phosphorus load in the agricultural area north of town (upstream) continues to increase. What can we do?
Connection: Brainstorm the causes of increased phosphorus loads in the upstream portion of the Chattahoochee River. Additionally, come up with some potential solutions to reduce the amount of phosphorus being added to the river.

Figure 18.8. This chart shows the amount of phosphorus, in tons per year, upstream and downstream of the Chattahoochee River at Atlanta, which is a major source of the local water supply. Credit: U.S. Geological Survey, Department of the Interior/USGS. (URL: https://water.usgs.gov/edu/phosphorus.html)
References:
Buendía, C., Kleidon, A. & Porporato, A. (2010) The role of tectonic uplift, climate, and vegetation in the long-term terrestrial phosphorous cycle. Biogeosciences 7, 2025–2038.
Chislock, M. F., Doster, E., Zitomer, R. A. & Wilson, A. E. (2013) Eutrophication: Causes, Consequences, and Controls in Aquatic Ecosystems. Nature Education Knowledge 4(4):10. (article available at http://www.nature.com/scitable/knowledge/library/eutrophication-causes-consequences-and-controls-in-aquatic-102364466)
Phosphorus and water. (Updated on December, 2, 2016). U.S. Geological Survey, Department of the Interio (USGS). URL: http://water.usgs.gov/edu/phosphorus.html
Image/Video Attribution
Figure 18.1 (left) Sampling Lago de Pátzcuaro during a cyanobacterial bloom with Ilyana Berry, Dr. John Berry, and Dr. Fernando Bernal-Brooks. © 2013 Nature Education Photo by Alan Wilson. All rights reserved. Copyright notice: https://www.nature.com/scitable/viewTermsOfUse
Figure 18.1 (right) “A dead African buffalo (Syncerus caffer) found in a reservoir with a dense bloom of the toxic cyanobacterium Microcystis at the Loskop Dam Nature Reserve in South Africa”. © 2013 Nature Education Photo by Jannie Coetzee. All rights reserved. Copyright notice: https://www.nature.com/scitable/viewTermsOfUse
Figure 18.3 ” Phosphogypsum stack “. Wikimedia Commons. Copyright: Harvey Henkelman.
Figure 18.4 ” Discolored water “. Image credit: Nation Ocean Service. National Oceanic and Atmospheric Administration, U.S. Department of Commerce. Public Domain.
Figure 18.5 “Eutrophication”. Image source: Utah Department of Environmental Quality.
Figure 18.6 ” The Dead Zone “. Image credit: the NASA Mississippi Dead Zone web site. National Aeronautics and Space Administration.
Video: Nutrient Loading In Lake Erie by National Science foundation. (Standard YouTube License).
Figure 18.8 ” Phosphorus charts of the Chattahoochee River at Atlanta “. Credit: U.S. Geological Survey, Department of the Interior/USGS. (URL: https://water.usgs.gov/edu/phosphorus.html)
References:
Fields, S. (2004). Global Nitrogen: Cycling out of Control. Environmental Health Perspectives, 112(10), A556–A563.
Scott L. Morford, Benjamin Z. Houlton, and Randy A. Dahlgren. (2011) Increased Forest Ecosystem Carbon and Nitrogen Storage from Nitrogen Rich Bedrock. Nature 477 (7362) : 78–81.
“The Nobel Prize in Chemistry 1918”. Nobelprize.org. Nobel Media AB 2014. Web. 15 Jun 2017. URL: http://www.nobelprize.org/nobel_prizes/chemistry/laureates/1918/index.html
“Overview of Greenhouse Gases: Nitous oxide emissions”. United States Environmental Protection Agengy. URL: https://www.epa.gov/ghgemissions/overview-greenhouse-gases#nitrous-oxide
Image/Video Attribution
Figure 17.1 (left) ” Chemist Fritz Haber “. Credit: The Nobel Foundation, 1919. Public domain. Created and published in 1919 in Sweden in Les Prix Nobel 1918 (p. 120).
Figure 17.1 (right) ” The setup used by Fritz Haber to create ammonia for the first time ” Public domain. Credit: JGvBerkel – Jewish Museum Berlin.
Figure 17.2 ” Nitrogen Cycle ” by U.S. Environmental Protection Agency. Public Domain.
Figure 17.3 (left) ” Legumes ” by Keith Weller, Agricultural Research Service, USDA. Public Domain.
Figure 17.3 (right) ” Soybean root nodules ” by JoJan, United States Department of Agriculture . Public Domain.
Figure 17.4 ” Diagram of nitrogen assimilation “. Created by: Joshua Dingomal. Diagram source: www.bbc.co.uk. Modification by Ching-Yu Huang.
Figure 17.5 ” Diagram of nitrogen mineralization “. Created by: Joshua Dingomal. Diagram source: www.bbc.co.uk. Modification by Ching-Yu Huang.
Figure 17.6 ” Denitrification reaction sequence “. Image source: USGS. Adopted from https://wwwbrr.cr.usgs.gov/projects/EC_biogeochemistry/Cape.htm. Public Domain.
Figure 17.7 ” Global Nitrogen: Cycling out of Control”. by Scott Fields. Global Nitrogen: Cycling out of Control . Environmental Health Prospect, 2004,112(10). Open access article. (Copying and redistribution of this article are permitted in all media for any purpose) (https://www.ncbi.nlm.nih.gov/pmc/articles/PMC1247398/accessed 6/8/17)
Figure 17.8 “A rising tide.” Credit: Scott Fields. Global Nitrogen: Cycling out of Control. Environmental Health Prospect, 2004,112(10). Open access article. (Copying and redistribution of this article are permitted in all media for any purpose) (https://www.ncbi.nlm.nih.gov/pmc/articles/PMC1247398/accessed 6/8/17)
Figure 17.9 ” Ozone in stratosphere and troposphere layers “. Image source: The field museum, Chicago.
Figure 17.10 ” 2015 nitrous oxide emission by sources pie chart ” from the U.S. Greenhouse Gas Emissions and Sinks: 1990-2015. Credit: United States Environmental Protection Agency. Public Domain.
Figure 17.11 ” Acid Rain Pathway “. Image source: United States Environmental Protection Agency. Public Domain.
Attribution
The Carbon Cycle is adapted from an ecology module edited and developed by Dr. Ching-Yu Huang, Biology instructor, Virginia Commonwealth University, VA.
This Open Educational Resource (OER) was generously funded through an “Affordable Learning Georgia” grant. Foundational content was derived from the OpenStax Biology text. The original text can be downloaded for free at: http://cnx.org/content/col11448/latest/
This new version, Introduction to Ecology, may be downloaded for free at: https://oer.galileo.usg.edu/biology-ancillary/7/
This work is licensed under the Creative Commons Attribution-NonCommercial 4.0 International License. To view a copy of this license, visit http://creativecommons.org/licenses/by-nc/4.0/ or send a letter to Creative Commons, PO Box 1866, Mountain View, CA 94042, USA.
