
Eutrophication
Chemical pollution from agriculture, industry, cities, and mining threatens global water quality. Some chemical pollutants have serious and well-known health effects, whereas many others have poorly known long-term health effects. In the U.S. currently more than 40,000 water bodies fit the definition of “impaired” set by EPA, which means they could neither support a healthy ecosystem nor meet water quality standards. In Gallup public polls conducted over the past decade Americans consistently put water pollution and water supply as the top environmental concerns over issues such as air pollution, deforestation, species extinction, and global warming.
Any natural water contains dissolved chemicals, some of which are important human nutrients while others can be harmful to human health. The concentration of a water pollutant is commonly given in very small units such as parts per million (ppm) or even parts per billion (ppb). An arsenic concentration of 1 ppm means 1 part of arsenic per million parts of water. This is equivalent to one drop of arsenic in 50 liters of water. To give you a different perspective on appreciating small concentration units, converting 1 ppm to length units is 1 cm (0.4 in) in 10 km (6 miles) and converting 1 ppm to time units is 30 seconds in a year. Total dissolved solids (TDS) represent the total amount of dissolved material in water. Average TDS values for rainwater, river water, and seawater are about 4 ppm, 120 ppm, and 35,000 ppm, respectively. In this chapter, we will focus on a specific type of chemical pollution, nutrient pollution, and its impacts.
Water Pollution Overview
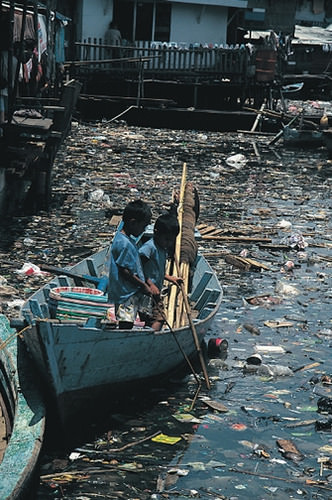
Water pollution is the contamination of water by an excess amount of a substance that can cause harm to human beings and/or the ecosystem. When we think of water pollution, we often think of obvious pollution, like the floating debris shown at the right, but harmful water pollution is often invisible. The level of water pollution depends on the abundance of the pollutant, the ecological impact of the pollutant, and the use of the water. Pollutants are derived from biological, chemical, or physical processes. Although natural processes such as volcanic eruptions or evaporation sometimes can cause water pollution, most pollution is derived from human, land-based activities. Water pollutants can move through different water reservoirs, as the water carrying them progresses through stages of the water cycle, shown below. Water residence time (the average time that a water molecule spends in a water reservoir) is very important to pollution problems because it affects pollution potential. Water in rivers has a relatively short residence time, so pollution usually is there only briefly. Of course, pollution in rivers may simply move to another reservoir, such as the ocean, where it can cause further problems. Groundwater is typically characterized by slow flow and longer residence time, which can make groundwater pollution particularly problematic. Finally, pollution residence time can be much greater than the water residence time because a pollutant may be taken up for a long time within the ecosystem or absorbed onto sediment.
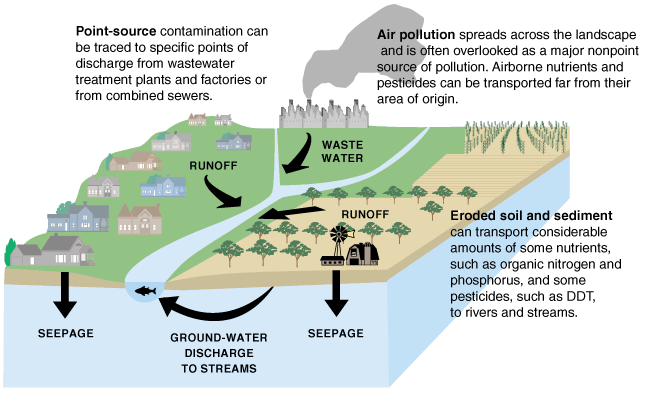
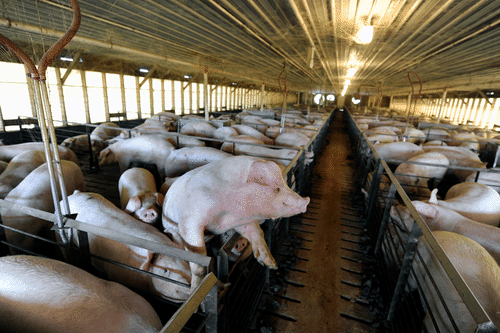
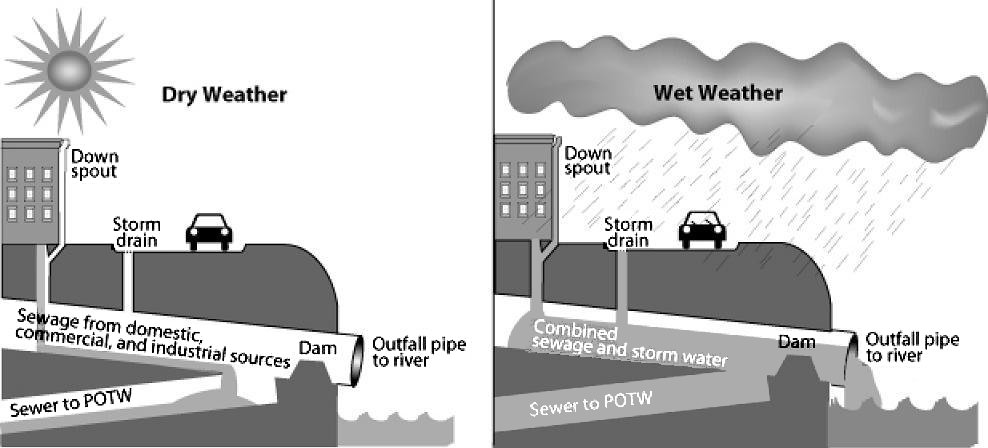
Pollutants enter water supplies from point sources, which are readily identifiable and relatively small locations, or nonpoint sources, which are large and more diffuse areas. Point sources of pollution include animal factory farms, such as the one shown to the right, that raise a large number and high density of livestock such as cows, pigs, and chickens. Also, pipes included are pipes from a factories or sewage treatment plants. Combined sewer systems that have a single set of underground pipes to collect both sewage and storm water runoff from streets for wastewater treatment can be major point sources of pollutants. During heavy rain, storm water runoff may exceed sewer capacity, causing it to back up and spilling untreated sewage directly into surface waters, as shown below.
Nonpoint sources of pollution include agricultural fields, cities, and abandoned mines. Rainfall runs over the land and through the ground, picking up pollutants such as herbicides, pesticides, and fertilizer from agricultural fields and lawns; oil, antifreeze, animal waste, and road salt from urban areas; and acid and toxic elements from abandoned mines. Then, this pollution is carried into surface water bodies and groundwater. Nonpoint source pollution, which is the leading cause of water pollution in the U.S., is usually much more difficult and expensive to control than point source pollution because of its low concentration, multiple sources, and much greater volume of water.
Types of Water Pollutants
Oxygen-demanding waste is an extremely important pollutant to ecosystems. Most surface water in contact with the atmosphere has a small amount of dissolved oxygen, which is needed by aquatic organisms for cellular respiration. Bacteria decompose dead organic matter and remove dissolved oxygen (O2) according to the following reaction:
organic matter+O2→CO2+H2O
Too much decaying organic matter in water is a pollutant because it removes oxygen from water, which can kill fish, shellfish, and aquatic insects. The amount of oxygen used by aerobic (in the presence of oxygen) bacterial decomposition of organic matter is called biochemical oxygen demand (BOD). The major source of dead organic matter in many natural waters is sewage; grass and leaves are smaller sources. An unpolluted water body with respect to BOD is a turbulent river that flows through a natural forest. Turbulence continually brings water in contact with the atmosphere where the O2 content is restored. The dissolved oxygen content in such a river ranges from 10 to 14 ppm O2, BOD is low, and clean-water fish such as trout. A polluted water body with respect to oxygen is a stagnant deep lake in an urban setting with a combined sewer system. This system favors a high input of dead organic carbon from sewage overflows and limited chance for water circulation and contact with the atmosphere. In such a lake, the dissolved O2 content is ≤5 ppm O2, BOD is high, and low O2-tolerant fish, such as carp and catfish dominate.
Excessive plant nutrients, particularly nitrogen (N) and phosphorous (P), are pollutants closely related to oxygen-demanding waste. Aquatic plants require about 15 nutrients for growth, most of which are plentiful in water. N and P are called limiting nutrients, however, because they usually are present in water at low concentrations and therefore restrict the total amount of plant growth. This explains why N and P are major ingredients in most fertilizer. High concentrations of N and P from human sources (mostly agricultural and urban runoff including fertilizer, sewage, and phosphorus-based detergent) can cause cultural eutrophication, which leads to the rapid growth of aquatic producers, particularly algae. Thick mats of floating algae or rooted plants lead to a form of water pollution that damages the ecosystem by clogging fish gills and blocking sunlight. A small percentage of algal species produce toxins that can kill animals, including humans. Exponential growths of these algae are called harmful algal blooms. When the prolific algal layer dies, it becomes oxygen-demanding waste, which can create very low O2 concentrations in the water (< 2 ppm O2), a condition called hypoxia. This results in a dead zone because it causes death from asphyxiation to organisms that are unable to leave that environment. An estimated 50% of lakes in North America, Europe, and Asia are negatively impacted by cultural eutrophication. In addition, the size and number of marine hypoxic zones have grown dramatically over the past 50 years including a very large dead zone located offshore Louisiana in the Gulf of Mexico. Cultural eutrophication and hypoxia are difficult to combat, because they are caused primarily by nonpoint source pollution, which is difficult to regulate, and N and P, which are difficult to remove from wastewater.
The Chesapeake Bay has experienced significant cultural eutrophication. Read the article below from The Conversation to learn more about how efforts to reduce eutrophication in the Chesapeake Bay are paying off.
Cutting pollution in the Chesapeake Bay has helped underwater grasses rebound
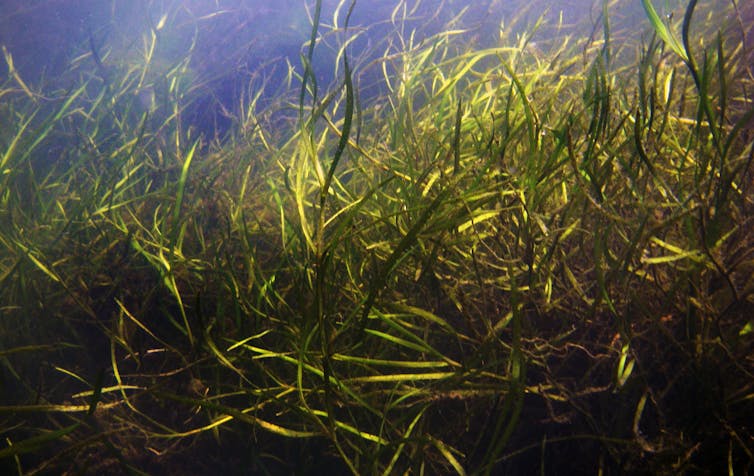
Cassie Gurbisz/University of Maryland Center for Environmental Science, CC BY-ND
Bill Dennison, University of Maryland Center for Environmental Science and Robert J. Orth, Virginia Institute of Marine Science
Seagrasses are the “coastal canaries” of oceans and bays. When these underwater flowering plants are sick or dying, it means the ecosystem is in big trouble – typically due to pollution that reduces water quality. But when they are thriving and expanding, it is a sign that the ecosystem is becoming healthier.
We have collaborated on seagrass research for three decades in the Chesapeake Bay and beyond. One of us (Bob “JJ” Orth) has mapped and studied the bay’s submerged aquatic vegetation since the 1980s. And the other (Bill Dennison) studies seagrass ecophysiology and has led efforts to make this science understandable and useful.
Seagrasses are critical to a healthy Chesapeake Bay. They provide habitat for fish and shellfish, stabilize sediments and help clarify the water. The bay’s grasses declined sharply in the 1970s, as pollution and development degraded its water quality. States around the bay have been working together since 2010 on a sweeping plan to clean it up and restore its ecosystems.
In a new study, we provide conclusive evidence that reducing discharges of nitrogen, phosphorus and other pollutants into the bay has produced the largest resurgence of underwater grasses ever recorded anywhere. This success shows that coastal ecosystems are resilient and that concerted efforts to reduce nutrient pollution can result in substantial improvements.

Melissa Merritt/USEPA, CC BY-ND
Cutting nutrient pollution boosts seagrasses
Ten years ago we led an effort through the National Center for Ecological Analysis and Synthesis to understand the global trajectories of seagrasses. What we found was that seagrasses were being lost at an alarming rate, equivalent to a soccer field of seagrass every 30 minutes since 1980.
So when we began to observe net increases over the past few years in the abundance of multiple types of seagrasses (collectively known as submerged aquatic vegetation) in our beloved Chesapeake Bay, we knew this event was globally unique.
To discern what was happening, we partnered with the Chesapeake Bay Program to initiate what is called a synthesis effort. Synthesis science brings together diverse teams of experts from different fields to pull new insights out of existing data.

USGS
We had access to 30 years of annual surveys of underwater grasses that JJ Orth personally oversees, plus a 30-year water quality data set collected by the Chesapeake Bay Program. Scientists from the Virginia Institute of Marine Science, University of Maryland Center for Environmental Science, Bigelow Laboratory for Ocean Sciences, the U.S. Geological Survey, the National Socio-Environmental Synthesis Center, St. Mary’s College of Maryland, the Smithsonian Environmental Research Center, the Maryland Department of Natural Resources, Texas A&M University-Corpus Christi and the U.S. Environmental Protection Agency provided analytical firepower to help assess this complex information.
We started by identifying ways in which activities on land could affect trends in water quality and underwater grass abundance. Then we tested our hypothesized linkages using structural equation models that analyzed data in two different ways.
One approach focused on the cascade of nitrogen and phosphorus moving from sources on land, such as wastewater discharge and stormwater runoff, into waterways. The other showed what happened to underwater grasses once these nutrients entered in the water. Nutrients overfertilize the bay, creating huge blooms of algae that die and deplete oxygen from the water. This produces “dead zones” that cannot support fish or plant life.
Chesapeake Biological Laboratory/University of Maryland Center for Environmental Science, CC BY-ND
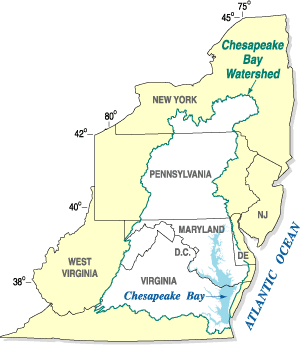
In our analysis, we found conclusive evidence that reductions of excess nitrogen and phosphorus caused the underwater grass recovery in the Chesapeake Bay. Since 1984, the quantity of nitrogen entering the bay has decreased by 23 percent and phosphorus has fallen by 8 percent, thanks to a “pollution diet” that the EPA established in 2010. The plan, formally called a Total Maximum Daily Load (TMDL), requires states in the bay’s 64,000-square mile watershed to reduce specific pollutants entering the bay to target levels on a fixed schedule.
As a result, underwater grasses have increased by over 300 percent and have reappeared in some locations around the bay where they had not been observed for decades.
A healthier Chesapeake Bay
For the past 12 years, we have been using underwater grasses and other water quality data to produce an annual Chesapeake Bay report card. Our 2017 report card describes progress across the board, with 7 out of 15 reporting regions around the bay showing significant improvement and the rest holding steady.
We attribute these improvements to the TMDL plan. In particular, upgrades at area wastewater treatment facilities have reduced nitrogen and phosphorus inputs into the bay. Catalytic converters on automobiles and smokestack scrubbers in power plants have reduced atmospheric nitrogen emissions and subsequent deposition that finds its way into bay waters. It appears that these management actions are beginning to pay off, although there is more to do – especially reducing nutrient pollution from agriculture.
Progress at risk
The Chesapeake Bay Program is a partnership between six states (New York, Pennsylvania, Maryland, Delaware, West Virginia, Virginia), the District of Columbia and the federal government, represented by the EPA. It heavily leverages federal funding by engaging community groups, local municipalities and nongovernmental organizations to carry out actions that help reduce pollution entering the bay. Examples include re-engineering urban surfaces to reduce stormwater runoff and subsidizing farmers to grow winter cover crops that help retain nutrients on fields.
When EPA Administrator Scott Pruitt was Oklahoma’s attorney general, he joined other states in a lawsuit to block the Chesapeake Bay cleanup, calling it a federal overreach. Now, however, Pruitt has pledged to support the program, which was upheld by a federal court in 2013 and sustained on appeal in 2015.
But President Trump’s 2017 budget called for eliminating the Chesapeake Bay Program completely. Congress enacted only small cuts, but Trump’s 2018 budget request cuts the program’s funding by 90 percent – ironically, just when we are finally starting to reverse degradation from past decades.
The Chesapeake Bay is arguably the best-studied estuary on the planet, and the fact that our study connects management actions to a huge resurgence of underwater grasses is a tribute to this rich history. Ongoing efforts to restore the bay have produced lessons about how pollution abatement can lead to ecosystem recovery.
These insights can and should be applied to other water bodies affected by nutrient pollution. We hope the story of the Chesapeake Bay’s recovery inspires similar actions in many other places.
Bill Dennison, Professor of Marine Science and Vice President for Science Applications, University of Maryland Center for Environmental Science and Robert J. Orth, Professor of Marine Science, Virginia Institute of Marine Science
This article is republished from The Conversation under a Creative Commons license. Read the original article.
Attribution
Essentials of Environmental Science by Kamala Doršner is licensed under CC BY 4.0. It was modified from the original by Matthew R. Fisher for Environmental Biology.
