
2.6 Thickness Standards for Polishing Thin Sections
Elizabeth Johnson; Juhong Christie Liu; and Mark Peale
In the previous sections of this module, we learned that standard thin sections should be polished to a final thickness of 30 micrometers. But how do we know when we are (finally) to the correct standard thickness? The rock slice is attached to a glass slide and epoxy, so it is not possible to directly measure its thickness with a micrometer. In this unit, we explore how to use the optical properties of the minerals within the rock slice to determine when the desired thickness has been achieved.
Learning Objectives
- Explain how to use thickness standards to determine when a thin section is at the correct thickness.
Prior Knowledge and Skills
- 2.2 Thin section and thick section anatomy
- 2.4 Procedure: how to make a thin section (recommended)
-
2.5 Equipment: Thin Section Preparation (recommended)
- Experience using the petrographic microscope to identify minerals (recommended)
- For color-blind students: We are not concerned about naming individual colors in this unit. It is enough to distinguish first-, second-, and third- and higher sets of colors, which are of different brightness. Please ask for help from your instructor if necessary.
Key Terms
- Interference colors
- Birefringence
Guided Inquiry
The color of a mineral under cross-polarized light is called its interference color. Interference colors categorized by first, second, third, and fourth-order colors are shown in Figure 2.6.1:
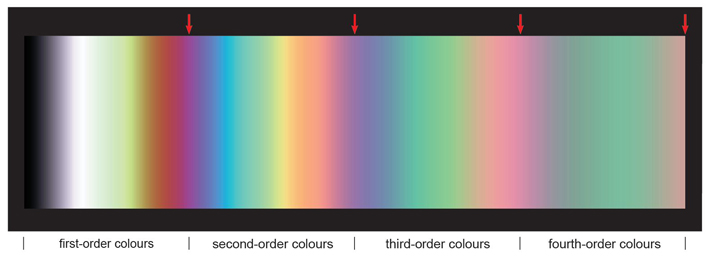
2.6.1 Which colors are more “pastel” in nature: first-order colors or third-order colors?
2.6.2 Is it easier to distinguish between first-order and second-order colors, or between third-order and fourth-order colors?
Figure 2.6.2 is the Michel-Levy Interference Color Chart. This diagram displays the interference colors in the chart, with verbal descriptions of first-, second-, and third-order colors below the x-axis. The y-axis on the left side of the diagram is thickness of the mineral (or thin section) in micrometers.
The physical property called birefringence is plotted along diagonal lines across the diagram. The value of birefringence for each diagonal line is listed at the top and right sides of the diagram. Minerals are listed across the top and right side of the diagram next to their birefringence value.
.jpg)
Click on the image to link to a larger version to help you answer the questions!
2.6.3 Locate quartz on the diagram (top row, 0.009 birefringence). Find the diagonal line right below 0.009, and follow it down to a thickness (y-axis) value of 30 micrometers. What is the interference color of quartz at this standard thickness?
2.6.4 What color would quartz be in a 40 micrometer thick sample?
Thickness Standards
Spectrum Petrographics created four sets of thin section standards for this project based upon an idea found in Allman and Lawrence (1972). Each rock was finished to a different thickness: 90, 60, 40, and 30 micrometers. We chose four rock standards comprised of different minerals to show how some common minerals appear at different thicknesses under cross-polarized light.
The four rock standards are:
- Biotite Granodiorite from the Small Biotite Facies of the La Posta Pluton, CA. (Clinkenbeard and Walawender, 1989). Minerals include quartz, feldspars, biotite.
- Marble from the Candoglia Marble Quarries, Italy (Mindat.org, 2018). The major mineral is calcite.
- Peridotite Xenolith from Salt Lake Crater, Hawaii (Sen et al. 2005). Minerals include olivine and orthopyroxene.
- Schist from the Wissahickon Formation, PA. Minerals include biotite, muscovite, quartz, and garnet. We also include plane-polarized light videos and images for this rock so that the brown color and pleochroism (https://en.wikipedia.org/wiki/Pleochroism) of biotite is visible.
For each rock, we obtained static images and videos at each thickness under cross-polarized light in the petrographic microscope. We also created scans of the entire thin section for each standard.
In the videos, we rotate the stage of the petrographic microscope to see the full range of colors for each mineral. This is the link to the full playlist of the thickness standards on YouTube: https://www.youtube.com/playlist?list=PLc1yUU5DczrVMgq7lE3q_tlcFezBESD7P
The complete list of all videos for each rock standard are in the References section below.
- Biotite Granodiorite from the Small Biotite Facies of the La Posta Pluton, CA. (Clinkenbeard and Walawender, 1989). Minerals include quartz, feldspars, biotite.
Figure 2.6.3 OSF/Images and Animations to Publish/ThinSections_Finals/ThinSectionsCalifornia.swf
Figure 2.6.4 OSF/Images and Animations to Publish/ThinSections_Finals/ThinSectionsCalifornia_Full.swf
- Marble from the Candoglia Marble Quarries, Italy (Mindat.org, 2018). The major mineral is calcite.
Figure 2.6.5 OSF/Images and Animations to Publish/ThinSections_Finals/ThinSectionsItaly.swf
Figure 2.6.6 OSF/Images and Animations to Publish/ThinSections_Finals/ThinSectionsItaly_Full.swf
- Peridotite Xenolith from Salt Lake Crater, Hawaii (Sen et al. 2005). Minerals include olivine and orthopyroxene.
- Schist from the Wissahickon Formation, PA. Minerals include biotite, muscovite, quartz, and garnet. We also include plane-polarized light videos and images for this rock so that the brown color and pleochroism (https://en.wikipedia.org/wiki/Pleochroism) of biotite is visible.
Guided Inquiry
2.6.5 Which of the rock samples is the most difficult to determine thickness from using its interference colors? Why?
Concept Checks
Concept Check 2.6.1
How do the interference colors of the minerals change as each sample becomes thinner? (Provide a specific example from one of the rocks) Is this consistent with the Michel-Levy chart?
Concept Check 2.6.2
Review the Michel-Levy diagram in Figure 2.6.2. Why do you think scientists decided 30 micrometers was the best standard thickness for thin sections? Why not 40, 60, or 90 micrometers?
Summary
Interference colors can be used for several common minerals to help determine the thickness of a rock slice on a thin section. Each mineral has a unique birefringence, producing different interference colors for different minerals at a specific thickness.
This method allows students and professionals to evaluate when they have reached the correct thickness for the rock slice when making a thin section.
References
Allman, M. and Lawrence, D.F. (1972) Geological Laboratory Techniques. Arco Publishing Company, New York, NY. 335 p.
Biotite granodiorite from the Small Biotite Facies of the La Posta Pluton, California. Minerals include quartz, feldspars, biotite.
AMiGEO (11/30/2018) Granodiorite La Posta, CA 30um xpl. https://youtu.be/4ggwtpw-ZN8
AMiGEO (11/30/2018) Granodiorite La Posta, CA 40um xpl. https://youtu.be/CRvNX9Qu9YI
AMiGEO (11/30/2018) Granodiorite La Posta, CA 60um xpl. https://youtu.be/5qeC0-l8FzU
AMiGEO (11/30/2018) Granodiorite La Posta, CA 90um xpl. https://youtu.be/6tUfFWFYIGI
Clinkenbeard, J.P. and Walawender M.J. (1989) Mineralogy of the La Posta pluton: Implications for the origin of zoned plutons in the eastern Peninsular Ranges batholith, southern and Baja California. American Mineralogist, Volume 74, pages 1258-1269.
http://www.minsocam.org/ammin/AM74/AM74_1258.pdf.
Marble from the Candoglia Marble Quarries, Italy. Major mineral is calcite.
AMiGEO (11/30/2018) Marble Candoglia, Italy 30um xpl. https://youtu.be/UQIOsS_XdzI
AMiGEO (11/30/2018) Marble Candoglia, Italy 40um xpl. https://youtu.be/6EitTiJPBzw
AMiGEO (11/30/2018) Marble Candoglia, Italy 60um xpl. https://youtu.be/ksg7zY88mnU
AMiGEO (11/30/2018) Marble Candoglia, Italy 90um xpl. https://youtu.be/xjuRKQI_t6k
Mindat.org (Ret. 12/1/2018) Candoglia marble quarries, Candoglia, Mergozzo, Ossola Valley, Verbano-Cusio-Ossola Province, Piedmont, Italy. https://www.mindat.org/loc-2101.html.
Peridotite Xenolith from Salt Lake Crater, Hawaii. Minerals include olivine, orthopyroxene.
AMiGEO (11/30/2018) Peridotite Salt Lake Crater, HI, 30um xpl. https://youtu.be/33DIDouOuRk
AMiGEO (11/30/2018) Peridotite Salt Lake Crater, HI, 40um xpl. https://youtu.be/DaXlicG4LXU
AMiGEO (11/30/2018) Peridotite Salt Lake Crater, HI, 60um xpl. https://youtu.be/9C0ldSlPDpE
AMiGEO (11/30/2018) Peridotite Salt Lake Crater, HI, 90um xpl. https://youtu.be/GX1-qyVhqXQ
Sen, Guatam, Keshav, Shantanu, and Bizimis, Michael (2005) Hawaiian mantle xenoliths and magmas: Composition and thermal character of the lithosphere. American Mineralogist, Volume 90, pages 871–887. http://ammin.geoscienceworld.org/content/gsammin/90/5-6/871.full.pdf.
Schist from the Wissahickon Formation, PA. Minerals include biotite, muscovite, quartz, and garnet.
AMiGEO (11/30/2018) Schist (Wissahickon Fm, PA) 30um xpl. https://youtu.be/omzq2BOijHI
AMiGEO (11/30/2018) Schist (Wissahickon Fm, PA) 40um xpl. https://youtu.be/tMw439t8-uY
AMiGEO (11/30/2018) Schist (Wissahickon Fm, PA) 60um xpl. https://youtu.be/4M1M3I0NMWM
AMiGEO (11/30/2018) Schist (Wissahickon Fm, PA) 90um xpl. https://youtu.be/d1kIt3RVnC4
AMiGEO (11/30/2018) Schist (Wissahickon Fm, PA) 30um ppl. https://youtu.be/iphFgRQYrds
AMiGEO (11/30/2018) Schist (Wissahickon Fm, PA) 40um ppl. https://youtu.be/TMKQ76yxp6w
AMiGEO (11/30/2018) Schist (Wissahickon Fm, PA) 60um ppl. https://youtu.be/Ns_iQ_4Q9as
AMiGEO (11/30/2018) Schist (Wissahickon Fm, PA) 90um ppl. https://youtu.be/XFHhjSc7f7c
Wikipedia contributors. (2018, June 28). Wissahickon Formation. In Wikipedia, The Free Encyclopedia. Retrieved 15:46, December 1, 2018, from https://en.wikipedia.org/w/index.php?title=Wissahickon_Formation&oldid=847820044
Licenses and Attributions
Videos created by AMiGEO (CC-BY)
Figures created by Elizabeth Johnson, Mark Peale, Juhong Christie Liu, JMU (Except as attributed elsewhere)
Text written by Elizabeth Johnson, JMU
Media Attributions
- Fig 2_6_1 Interference Colors The Open University © The Open University is licensed under a CC BY-NC-SA (Attribution NonCommercial ShareAlike) license
- Fig 2_6_2 Michel-Levy © ZEISS Microscopy from Germany is licensed under a CC BY-SA (Attribution ShareAlike) license
