
7.3 The Raman Shift and Reading Raman Spectra
Elizabeth Johnson
Learning Objectives
- Describe the concept of Raman shift.
- Read Raman spectra using Raman shift units.
Prior Knowledge and Skills
3.2 The Electromagnetic Spectrum
3.7 Electromagnetic Energy: Units Conversion
7.2 History of Raman Spectroscopy
Key Terms
- Wavenumber
- Raman Shift
- Intensity
Guided Inquiry
Raman Effect
Watch this video which provides a great visual demonstration of the Raman effect:
NanophotonGlobal. (January 6, 2017). Visual guide to Raman.
7.3.1. In this example, Raman scattering from liquid water is shown. What is the wavelength of the laser in nm, and what is the wavelength of Raman scattered light for the major peak of water (as stated in the video?)
Concept Check 7.3.2. If a violet laser is passed through a sample of water, do you think the Raman scattered light would still be red, like the example above? Why or why not? (Hint:If the laser was changed to 364 nm, at what wavelength would the major peak of water appear?)
Raman Plots
In practice, Raman spectra are plotted as Raman shift. Raman shift is the difference between the peak energies and the excitation laser energy. This allows comparison of a spectrum to other spectra even when different laser excitation energies are used.
The x axis of a conventional Raman spectra is plotted in wavenumber (cm-1) units, not in wavelength. For a review of wavenumbers, see 3.7 Electromagnetic Energy: Units Conversion.
The following links show examples of Raman spectra of different materials. Please look at these examples to compare and contrast the axes of the plots.
- InPhotonics. InPhotote Spectrometer Data. (ret. 3/17/2019) http://www.inphotonics.com/INPdata.htm National University of Ireland, Galway.
- Small Molecule/Forensics Research. (ret. 3/17/2019) http://www.nuigalway.ie/nanoscale/researchprojects/forensicsraman/
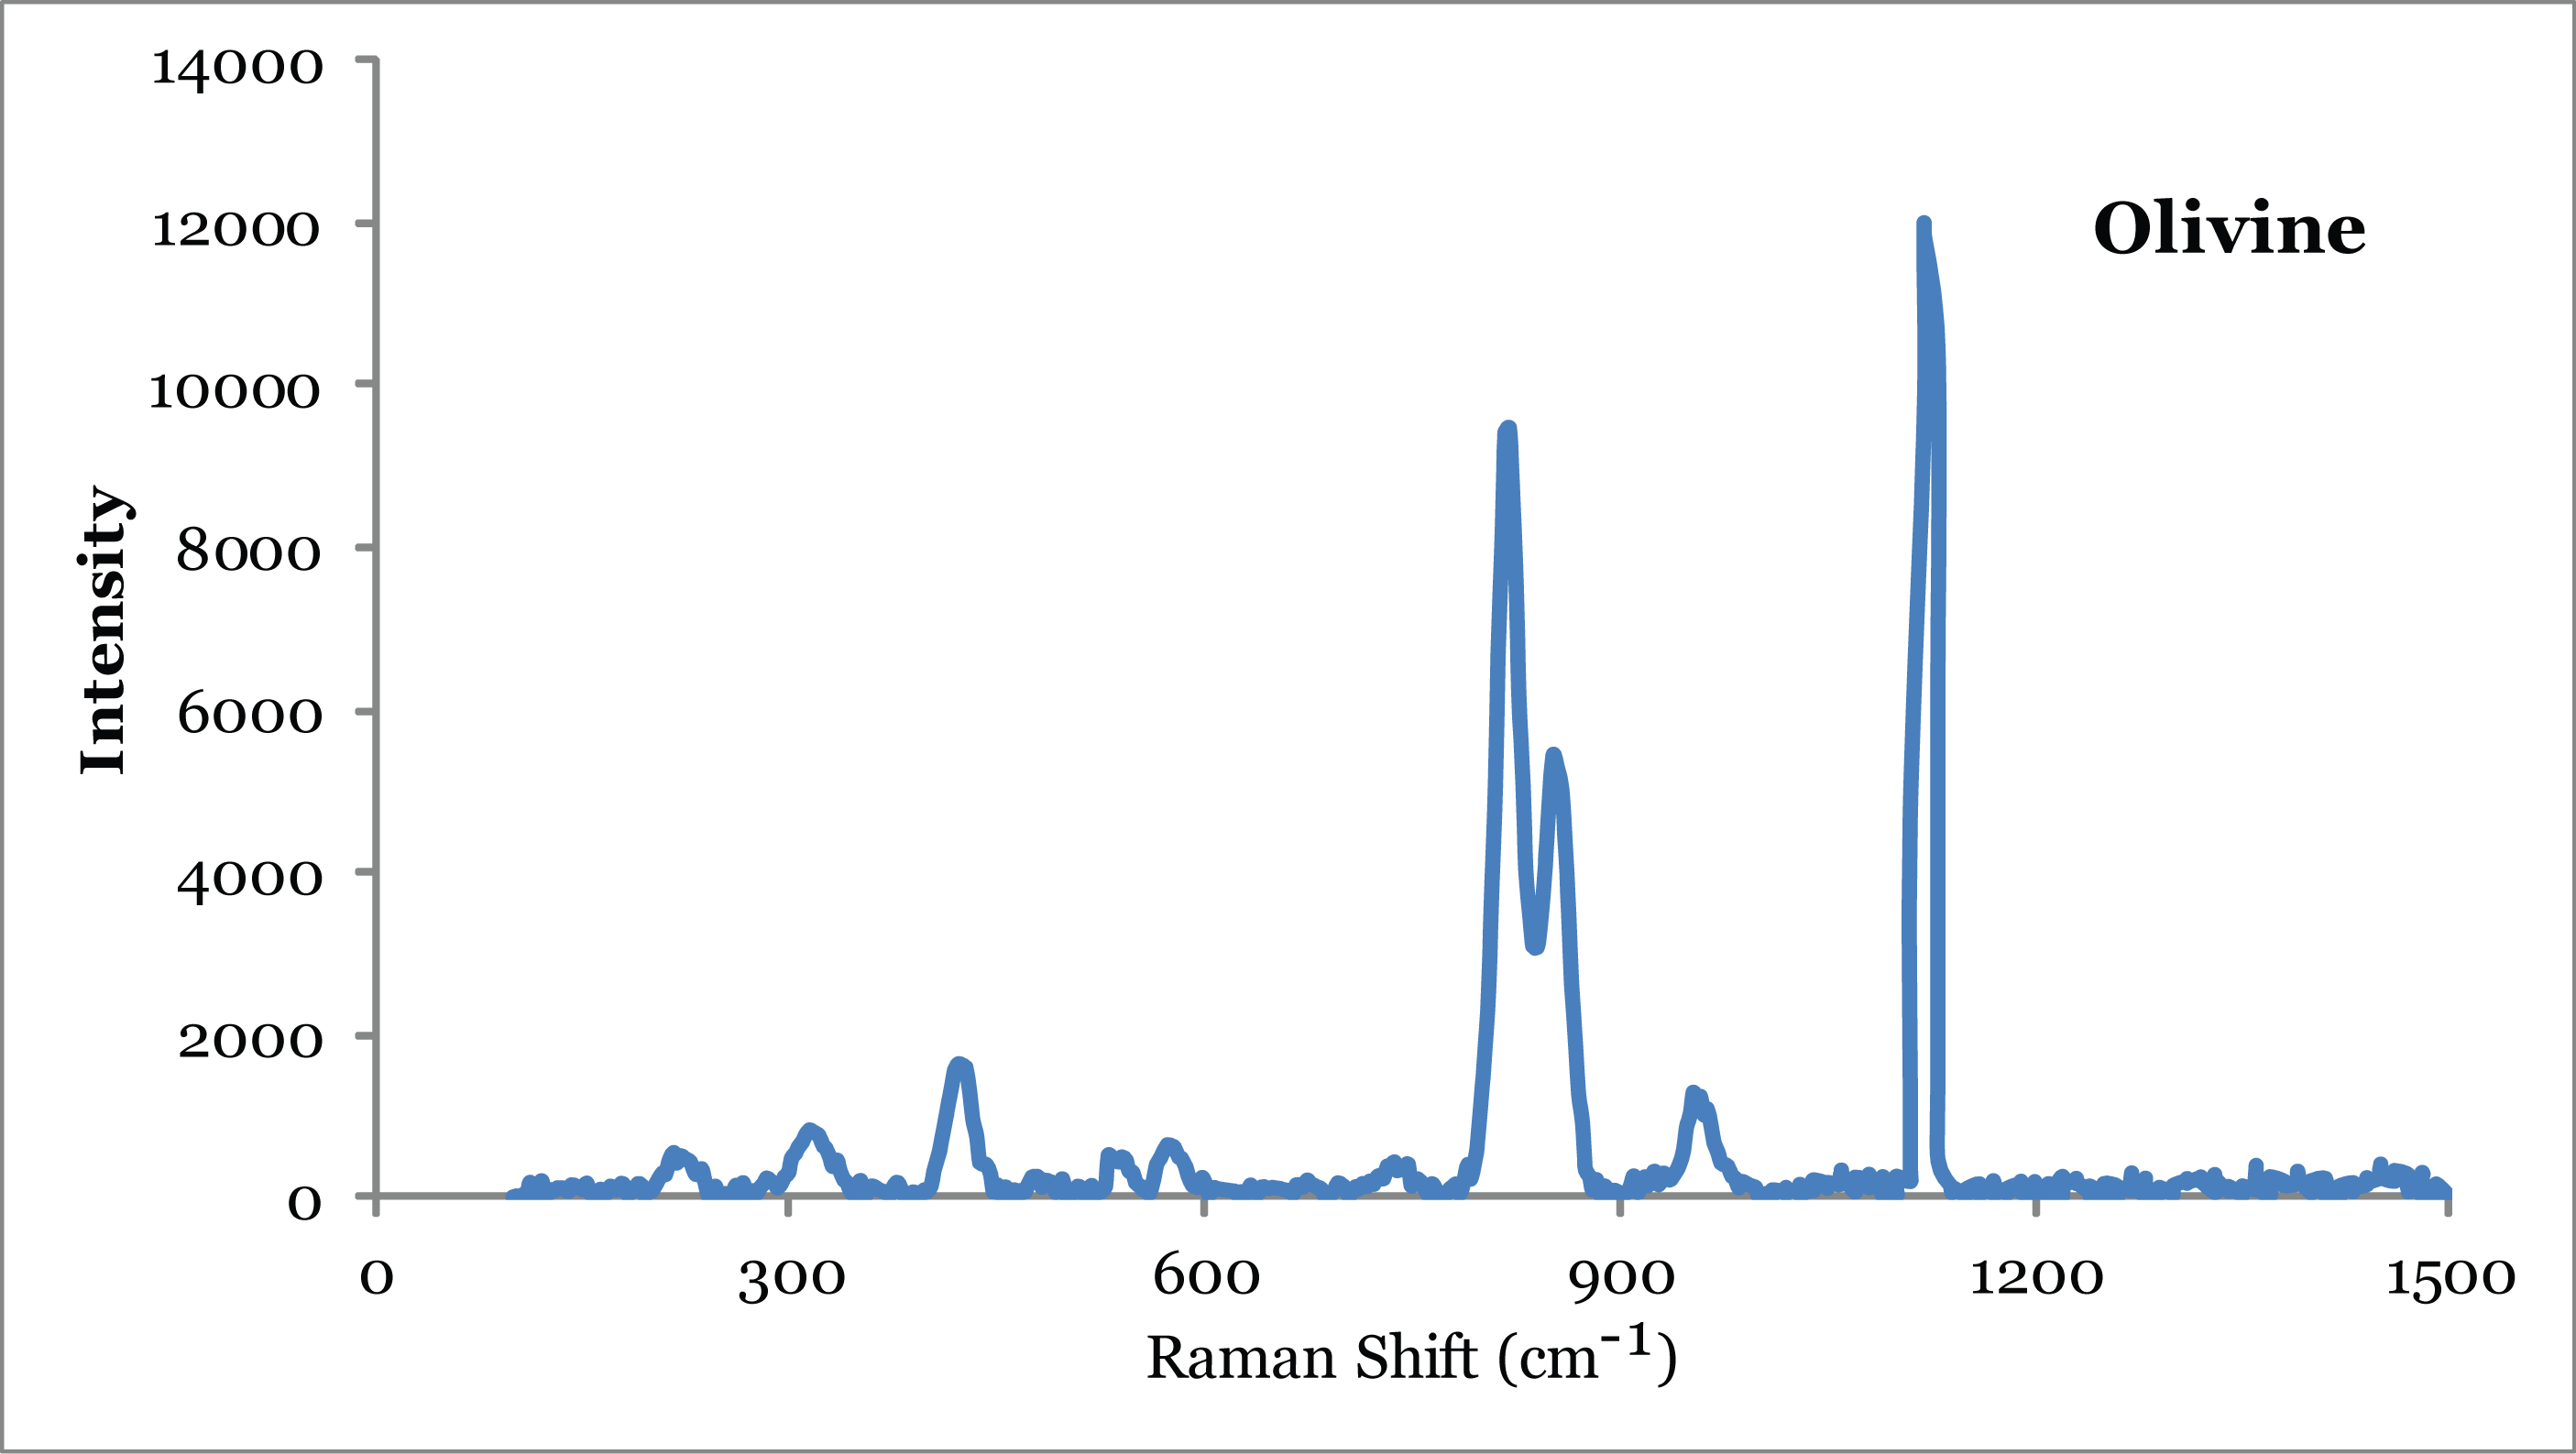
7.3.3. In the olivine spectrum, what is the energy difference between the tallest peak and the laser energy, in wavenumbers?
7.3.4. By looking at this data, can you tell which laser energy/wavelength was used?
7.3.5. What is/are the variable/s plotted on the y-axis (look at several sources)?
The counts from the detector are plotted in the y-axis, which is why people report this in different ways. Peak intensity in reflectance spectra can vary due to experimental conditions, count times, orientation of the sample, surface characteristics, etc.
Summary
Raman spectra are plotted in units of intensity (which can be arbitrary) versus Raman shift in wavenumbers (cm-1). The Raman shift is used so that data can be easily compared even when different laser wavelengths are used.
References
InPhotonics. InPhotote Spectrometer Data. (ret. 3/17/2019) http://www.inphotonics.com/INPdata.htm NanophotonGlobal. (January 6, 2017).
NanophotonGlobal. (January 6, 2017). Visual guide to Raman spectroscopy | Nanophoton. https://youtu.be/G1jXR5PhUc0
National University of Ireland, Galway. Small Molecule/Forensics Research. (ret. 3/17/2019) http://www.nuigalway.ie/nanoscale/researchprojects/forensicsraman/
Sylvia-Monique Thomas. Infrared and Raman spectroscopy. (ret. 3/17/2019) https://serc.carleton.edu/NAGTWorkshops/mineralogy/mineral_physics/raman_ir.html
