6.4 Chemical Bond Energies are Quantized
Elizabeth Johnson
Learning Objectives
- Describe the concept of quantization.
- Describe the quantized nature of chemical bond energy levels.
- Explain how chemical bond energies differ from the classical model of a vibrating spring.
Prior Knowledge and Skills
3.6 The Dual Nature of Electromagnetic Energy
3.7 Electromagnetic Energy: Units Conversion
6.3 The Classical Model: Chemical Bonds as Springs
Key Terms
- Potential Energy
- Hooke’s Law
- Simple Harmonic Motion
- Quantized Energy Levels
Guided Inquiry
Quantization
Although quantization may seem to be an unfamiliar concept, we encounter it frequently in quantum mechanics (hence the name). For example, US money is integral multiples of pennies. Similarly, musical instruments like a piano or a trumpet can produce only certain musical notes, such as C or F sharp. Because these instruments cannot produce a continuous range of frequencies, their frequencies are quantized. It is also similar to going up and down a hill using discrete stair steps rather than being able to move up and down a continuous slope. In this analogy, your potential gravitational energy increases with height – the higher you go, the greater the energy. As you go up a hill, your potential energy increases continuously. However, your potential energy changes by discrete values as you move from step to step on the staircase.
Figure 6.4.1. A continuous vs. a quantized gravitational potential energy system. In the continuous case (left) a system can have any potential energy, but in the quantized case (right), a system can only have certain values (other values are not allowed). (CC BY-NC; Ümit Kaya via LibreTexts).
Quantized Energy Levels of Chemical Bonds
Watch the end of this video connecting chemical bond energy to quantized bond energy levels:

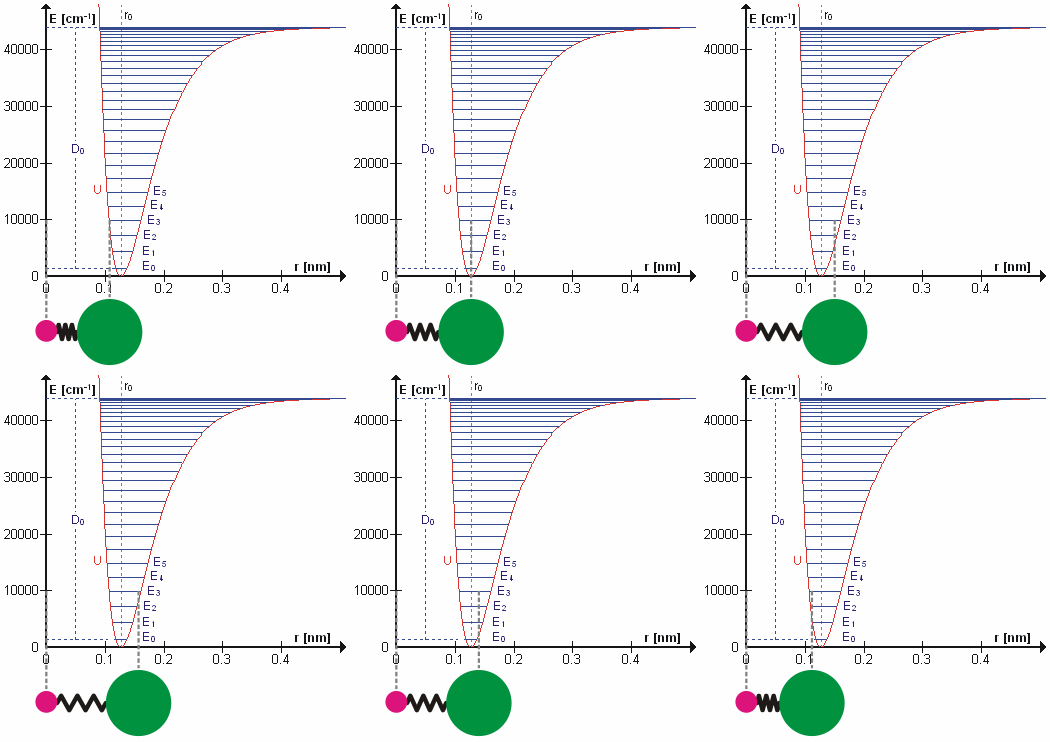
Based upon the concepts in the video and diagram above, answer these questions about the animated diagram of a chemical bond and its potential energy diagram (Fig. 6.4.2):
6.4.1 What is plotted on the y-axis?
6.4.2 What is described on the x-axis?
6.4.3 What does the red curve represent?
6.4.4 What are the horizontal blue lines?
6.4.5 How would the HCl molecule’s vibration change if it moved from E3 to E4? From E3 to E2?
6.4.6 Do vibrational spectroscopies measure the energy levels themselves, or the changes between energy levels?
References
Bozeman Science (Dec 17, 2013) Bond Length and Bond Energy. https://youtu.be/I9jd1Ew_YGU
Fowler, M., Hanson, D.M., Harvey, E., Sweeney, R., Zielinski, T.J. (ret. 10/2022). 11.2: Planck’s Quantum Theory in Chang, Physical Chemistry for the Biosciences.

