
22 GPS Data and Plate Motion
Elizabeth Johnson
Learning Objectives
Students will be able to:
- Describe the 3 components of motion recorded by a GPS.
- Determine the direction of motion of a GPS site from time series data.
Three Components of Motion
A GPS unit used for geologic monitoring measures motion in three dimensional space. Data from a GPS unit is reported in three components that describe the three dimensions of this space, much like we use an x-y-z grid to plot data on a 3D graph.
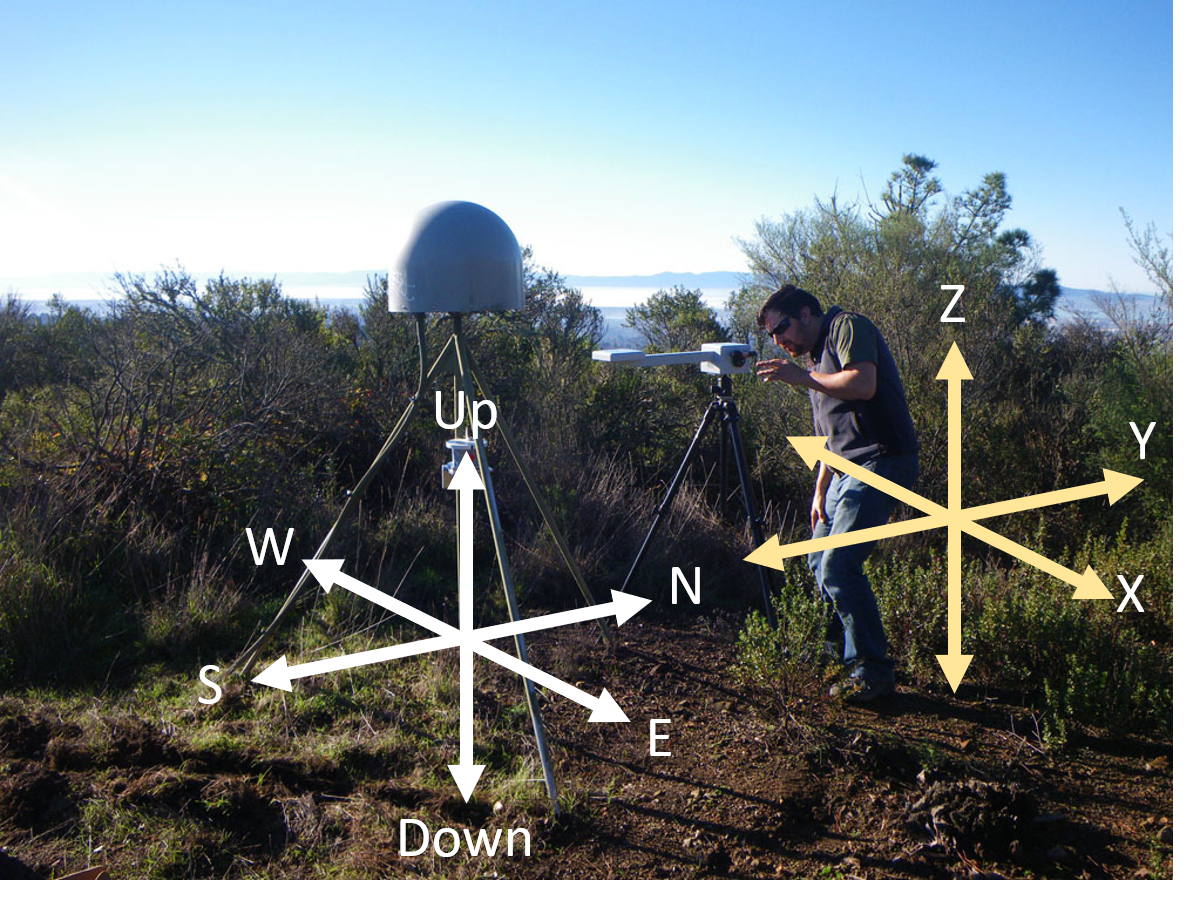
Instead of x, y, and z, the three components for GPS data are:
- motion in a North-South direction (changes in latitude- Latitude and Longitude);
- motion in an East-West direction (changes in longitude); and
- motion in an up-down (vertical height) direction.
Reading GPS Time Series Data
Please read this page about interpreting time series data:
https://spotlight.unavco.org/how-gps-works/gps-and-tectonics/gps-data.html
And then look at this reference sheet to understand how to read time series diagrams:
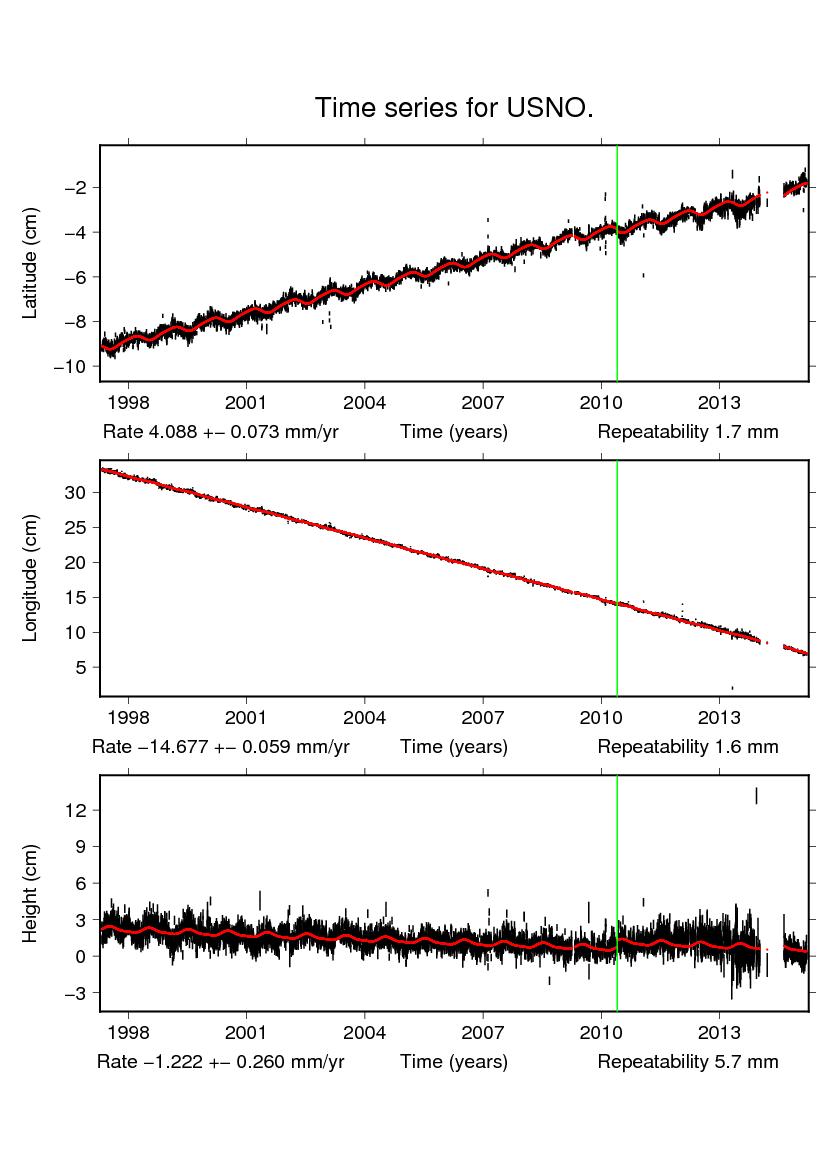
As a GPS station moves (because the tectonic plate it is attached to is moving), its position changes through time. The plots in Figure 11 show how the position of the GPS located at the US Naval Observatory in Washington, DC, changes in the North-South, East-West, and Up-Down directions through time. For this exercise, we will not pay attention to the third graph (height), because we are looking at the horizontal motion of plates.
Rates of Motion from Time Series Data
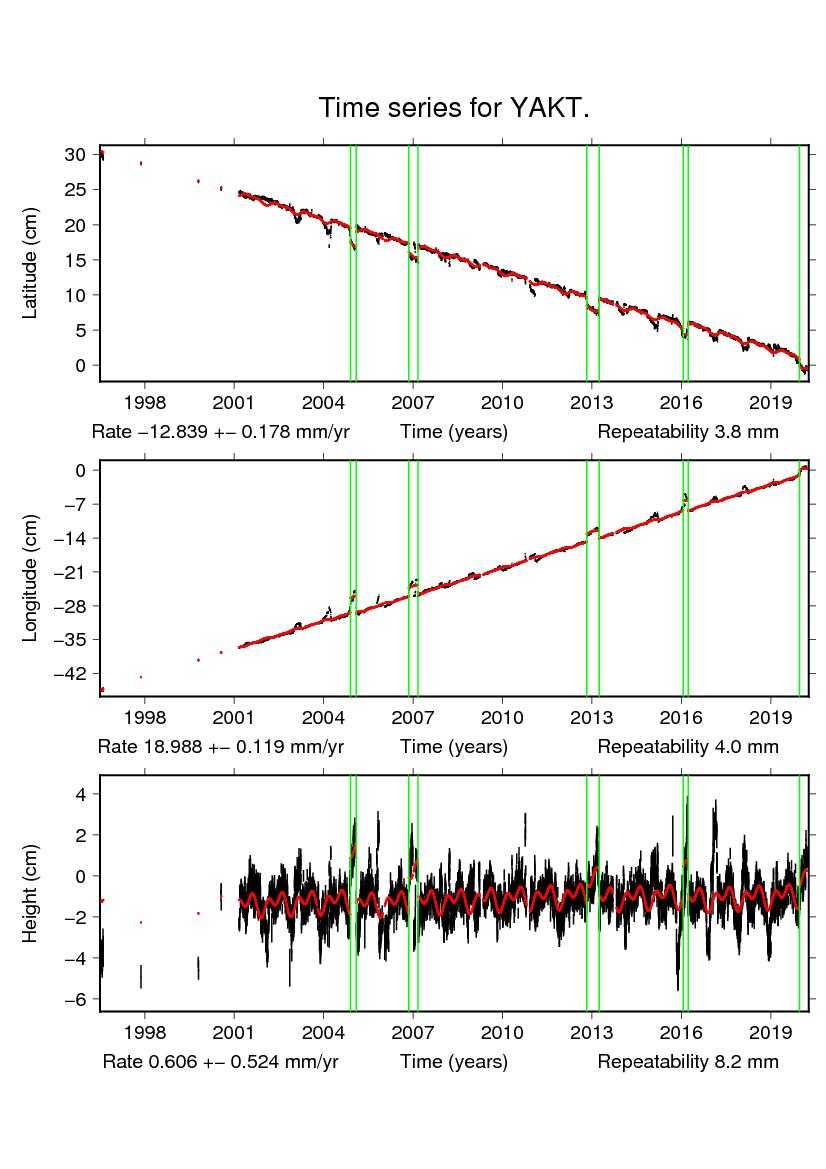
Below each graph of the time series, a rate is reported. For example, in Figure 12 for the top graph (changes in latitude, N-S), the rate of motion is reported as -12.839 millimeters / year (mm/yr), with an uncertainty of plus or minus 0.178 mm/yr.
A rate is a measurement of speed, or how far something travels in a given amount of time. The larger the magnitude of the rate, the faster something is travelling. For example, driving 25 mile/hour is legal on many residential streets. This is slower than driving 100 miles/hour (which is also illegal!).
Why is the rate negative for the top graph in Figure 12? This is because we have chosen “north” as being the positive direction, and “south” as the negative direction on our graphs. Because the station is moving -12.839 mm/yr, it tells us it is moving 12.839 mm/yr towards the south. This is (sort of) equivalent to putting your car in reverse and driving down the street backwards. You make negative progress in the direction your car is facing!
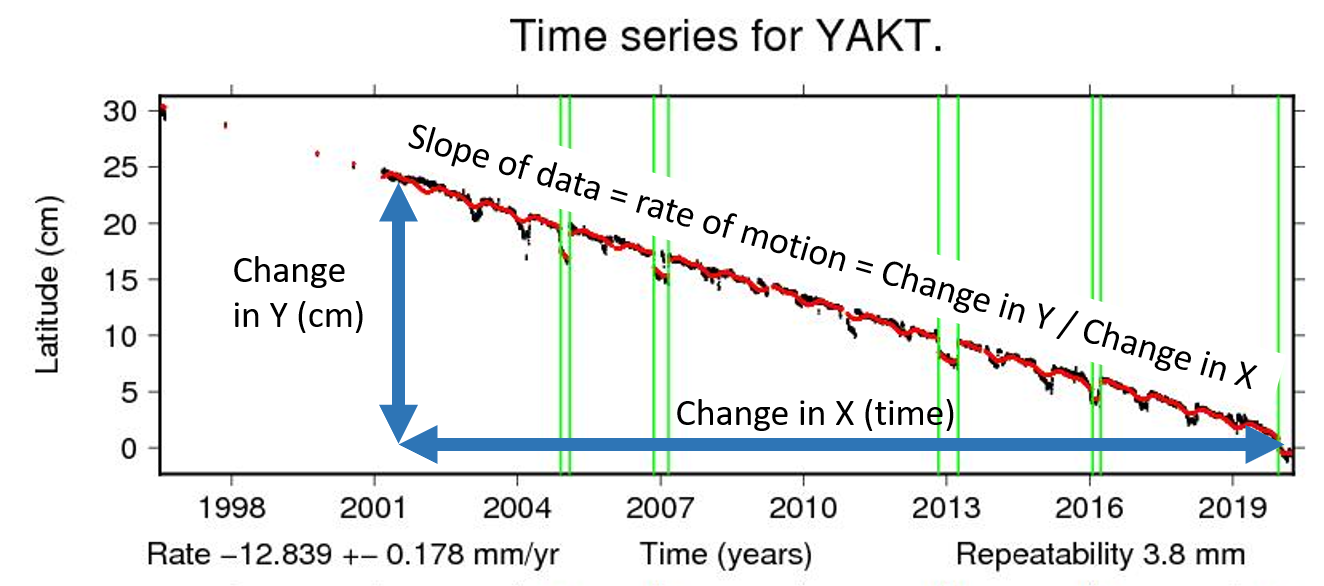
Rate is calculated from each graph by measuring the slope of the line on that graph, or the change in y (distance) / change in x (time). Luckily for us, all of the GPS station data include rates for each component of motion. This will allow us to determine the overall rate of motion for that station.
