
11 Topography and Bathymetry
Elizabeth Johnson
Learning Objectives
Students will be able to:
- Distinguish topography from bathymetry.
- Describe how topography and bathymetry vary along a profile.
- Define elevation, depth, and relief.
- Determine elevation/depth and relief from topographic and bathymetric maps.
Topography and Bathymetry
Topographic maps are a two-dimensional way to visualize three-dimensional changes in elevation and the shape of the surface of the land above sea level. In a similar way, bathymetric maps show the shape and changes in depth of the ocean floor below sea level.
Elevation, Depth, and Relief
Elevation is defined as the vertical distance above mean sea level (average sea level) in topographic maps. Bathymetric maps show depth below sea level. By definition, the coastline of an island or continent is at sea level = 0 feet = 0 meters.
Relief is the difference in elevation between two points on a map.
Relief = the elevation of the higher location – the elevation of the lower location.
Examples
Q: Point X has an elevation of 625 meters. Point Y has an elevation of 650 meters. What is the relief?
A: The relief is 650 – 625 = 25 meters between these two points.
Q: Point X has an elevation of 625 meters. Point Z is on the ocean floor at -200 meters depth. What is the relief?
A: The relief is 625 – (-200) = 825 meters.
The total relief of a map is the change in elevation from the very lowest to the very highest point on that specific map, and is calculated the same way as relief. Total relief gives us a sense of whether an area is mountainous or flat.
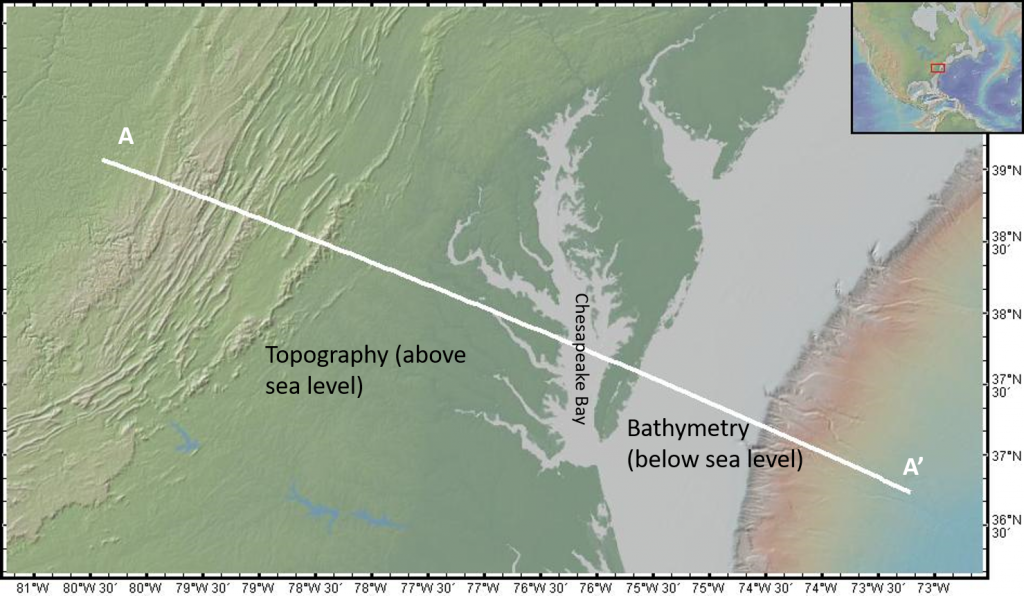
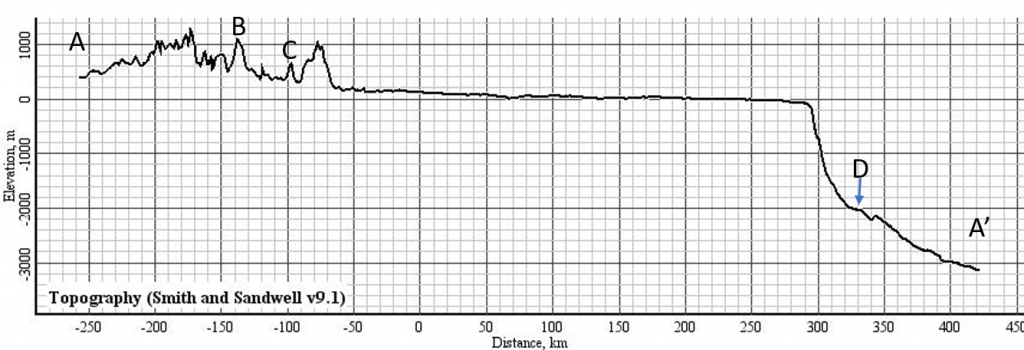
Figure 4 shows a topographic profile in which elevation is plotted as a function of distance along a line drawn across the surface of Earth. In Figure 3, the location of this line or profile is shown as the white line from A to A’.
Shaded relief maps help show topography by showing shadows and bright areas illuminated by a light source at an angle to the surface. This is meant to replicate sunlight casting shadows on the land surface.
You can view shaded relief maps in Google Maps (https://www.google.com/maps) using the terrain overlay.
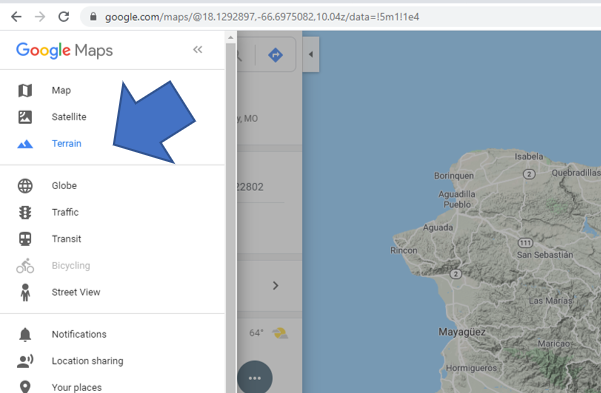
Try viewing shaded relief on the Google Map below. Click on the map, then select terrain.
