
23 Plate Motion Vectors
Elizabeth Johnson
Learning Objectives
Students will be able to:
- Interpret rate data from time series plots to determine a plate motion vector (magnitude and direction).
- Read the rate of a vector using a vector scale.
What is a Vector?
A vector describes the rate and direction of something. The azimuth of the vector indicates the direction of motion (see Azimuth). The length of the vector arrow indicates the rate of motion. The longer the vector, the faster it is moving. A scale is provided for the length of vectors on a map.
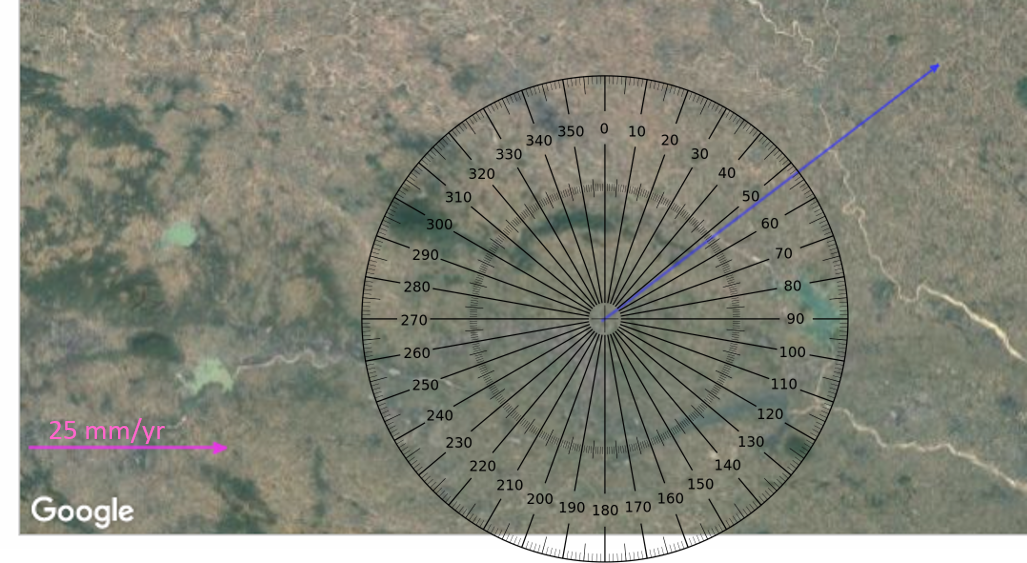
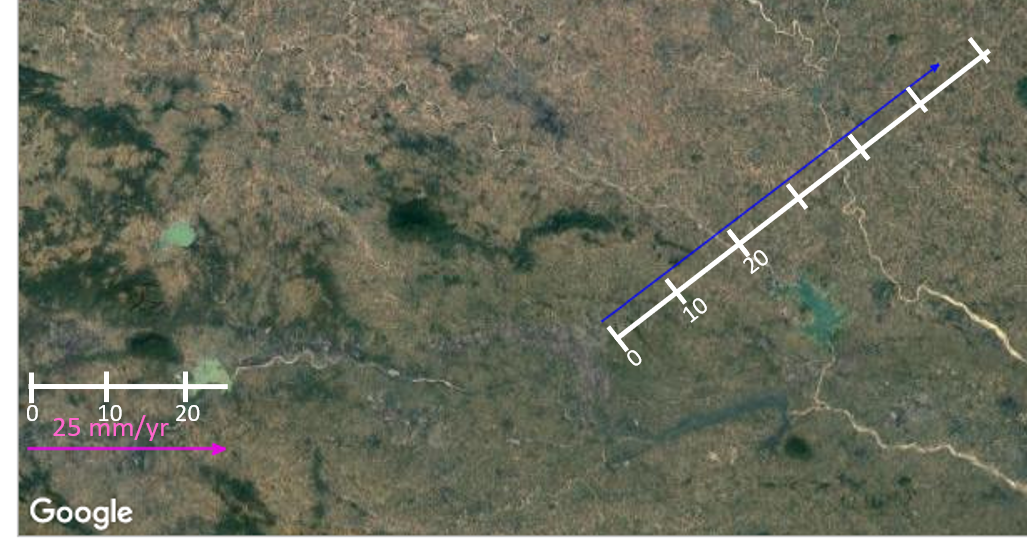
In Figures 15 and 16 below, we see a plate motion vector mapped for a GPS unit in the Himalayan Mountains in India:
Please note: these questions are intentionally NOT interactive.
Question 10: What is the azimuth of the plate motion vector (Figure 15)?
- 53 degrees
- 67 degrees
- 233 degrees
Question 11: What is the rate of motion for this GPS station (Figure 16)?
- 20 mm/yr
- 45 mm/yr
- 55 mm/yr
Adding N-S and E-W vectors to determine a plate motion vector
How do scientists go from the time series graphs and rates (GPS Data and Plate Motion) to plotting a vector on a map?
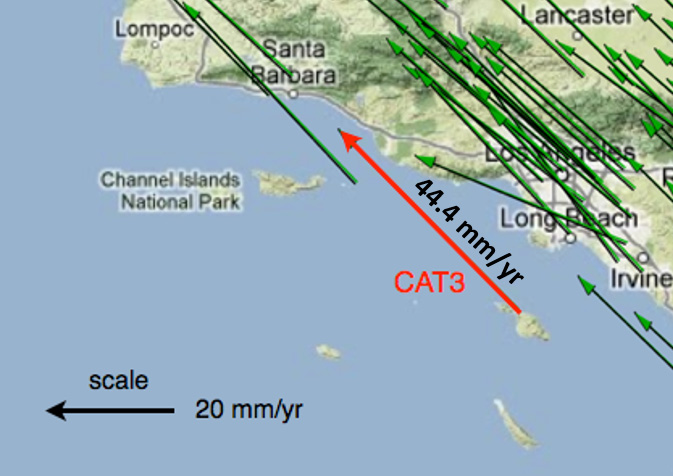
Looking back at the example of Catalina Island: https://spotlight.unavco.org/how-gps-works/gps-and-tectonics/gps-data.html
You can see in Figure 1 on the web page linked above that the time series record a rate of motion of 31.6 mm/yr to the north and 31.2 mm/yr to the west (-31.2 on the east scale).
Figure 2 on the web page shows how these two component vectors can be added together to produce the total motion of the station (the red vector, 44.4 mm/yr).
This interactive diagram demonstrates the concepts of vector addition. You can use this diagram outside this book by copying and pasting this link in a new window: https://phet.colorado.edu/sims/html/vector-addition/latest/vector-addition_en.html
Figure 17. PhET interactive diagram for vectors.
Instructions for using Figure 17:
Using the PhET interactive vector diagram, determine the magnitude and azimuth of a plate motion vector for a GPS unit in Bucharest, Romania:
Figure 18. Location of Bucharest, Romania.
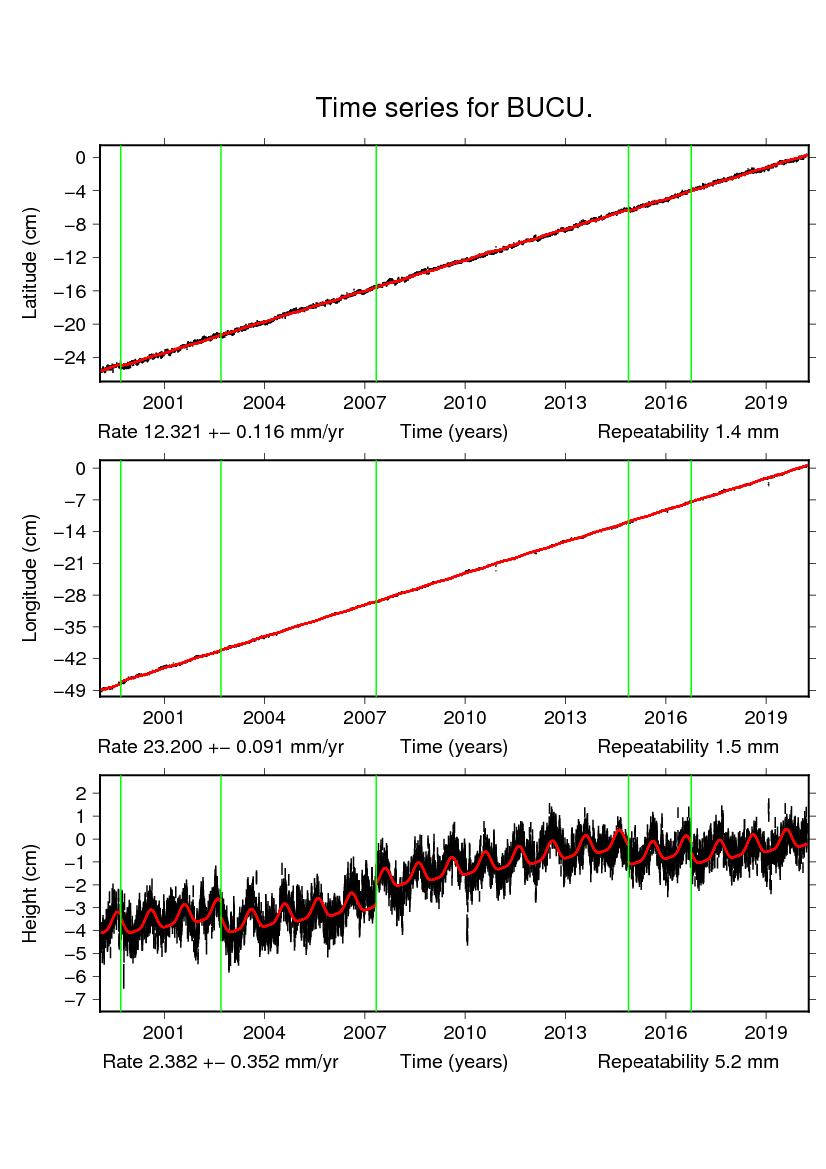
Question 12: Use the PhET vector diagram (Figure 17) to determine the total rate of motion of the BUCU (Bucharest) GPS station from the time series in Figure 19. Use the nearest whole number for the rates (for example, 10.4 mm/yr is approximated by using 10 mm/yr on the diagram). What is the vector length for the total rate of motion?
- 12 mm/yr
- 20 mm/yr
- 25.9 mm/yr
- 28.2 mm/yr
Question 13: Use the PhET vector diagram (Figure 17) to determine the azimuth of the motion vector for the BUCU (Bucharest) GPS station from the time series in Figure 19. What is the azimuth?
- 12.2 degrees
- 27.6 degrees
- 45.5 degrees
- 62.4 degrees
