
19 Chapter 19 The Cardiovascular System: The Heart
By Aylin Marz
Motivation.
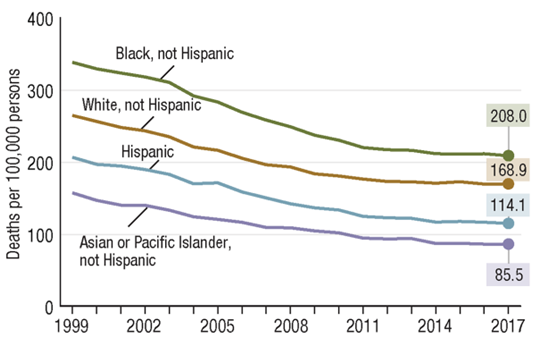
Heart disease is the number one cause of death in the U.S.racial and ethnic disparities observed in heart disease deaths also shows a disproportionately higher number of deaths due to heart disease are in Black, non-Hispanic persons. Some risk factors such as obesity, hypertension, diabetes, and high cholesterol that contribute to heart disease deaths are disproportionately higher in African American communities. Both biological factors and non-biological societal issues contribute to these disparities. As health practitioners in your communities, it is very important to be aware of the risks facing your patients and advise them for heart-healthy lifestyles. Caring and good choices can lower risk.
Learning Objectives
Upon completion of the work in this chapter students should be able to:
- Dissect a pig’s or sheep’s heart and label the main chambers, valves, vessels, and other structures.
- Identify and trace the path of blood flow through the heart using the dissected heart
- Relate electrocardiogram (ECG) peaks to the electrical activity, systole/diastole of the heart chambers, and the “lub” and “dub” sounds of the heart beat
- Compare the ECG of a normal heart to a diseased heart’s ECG
Background.
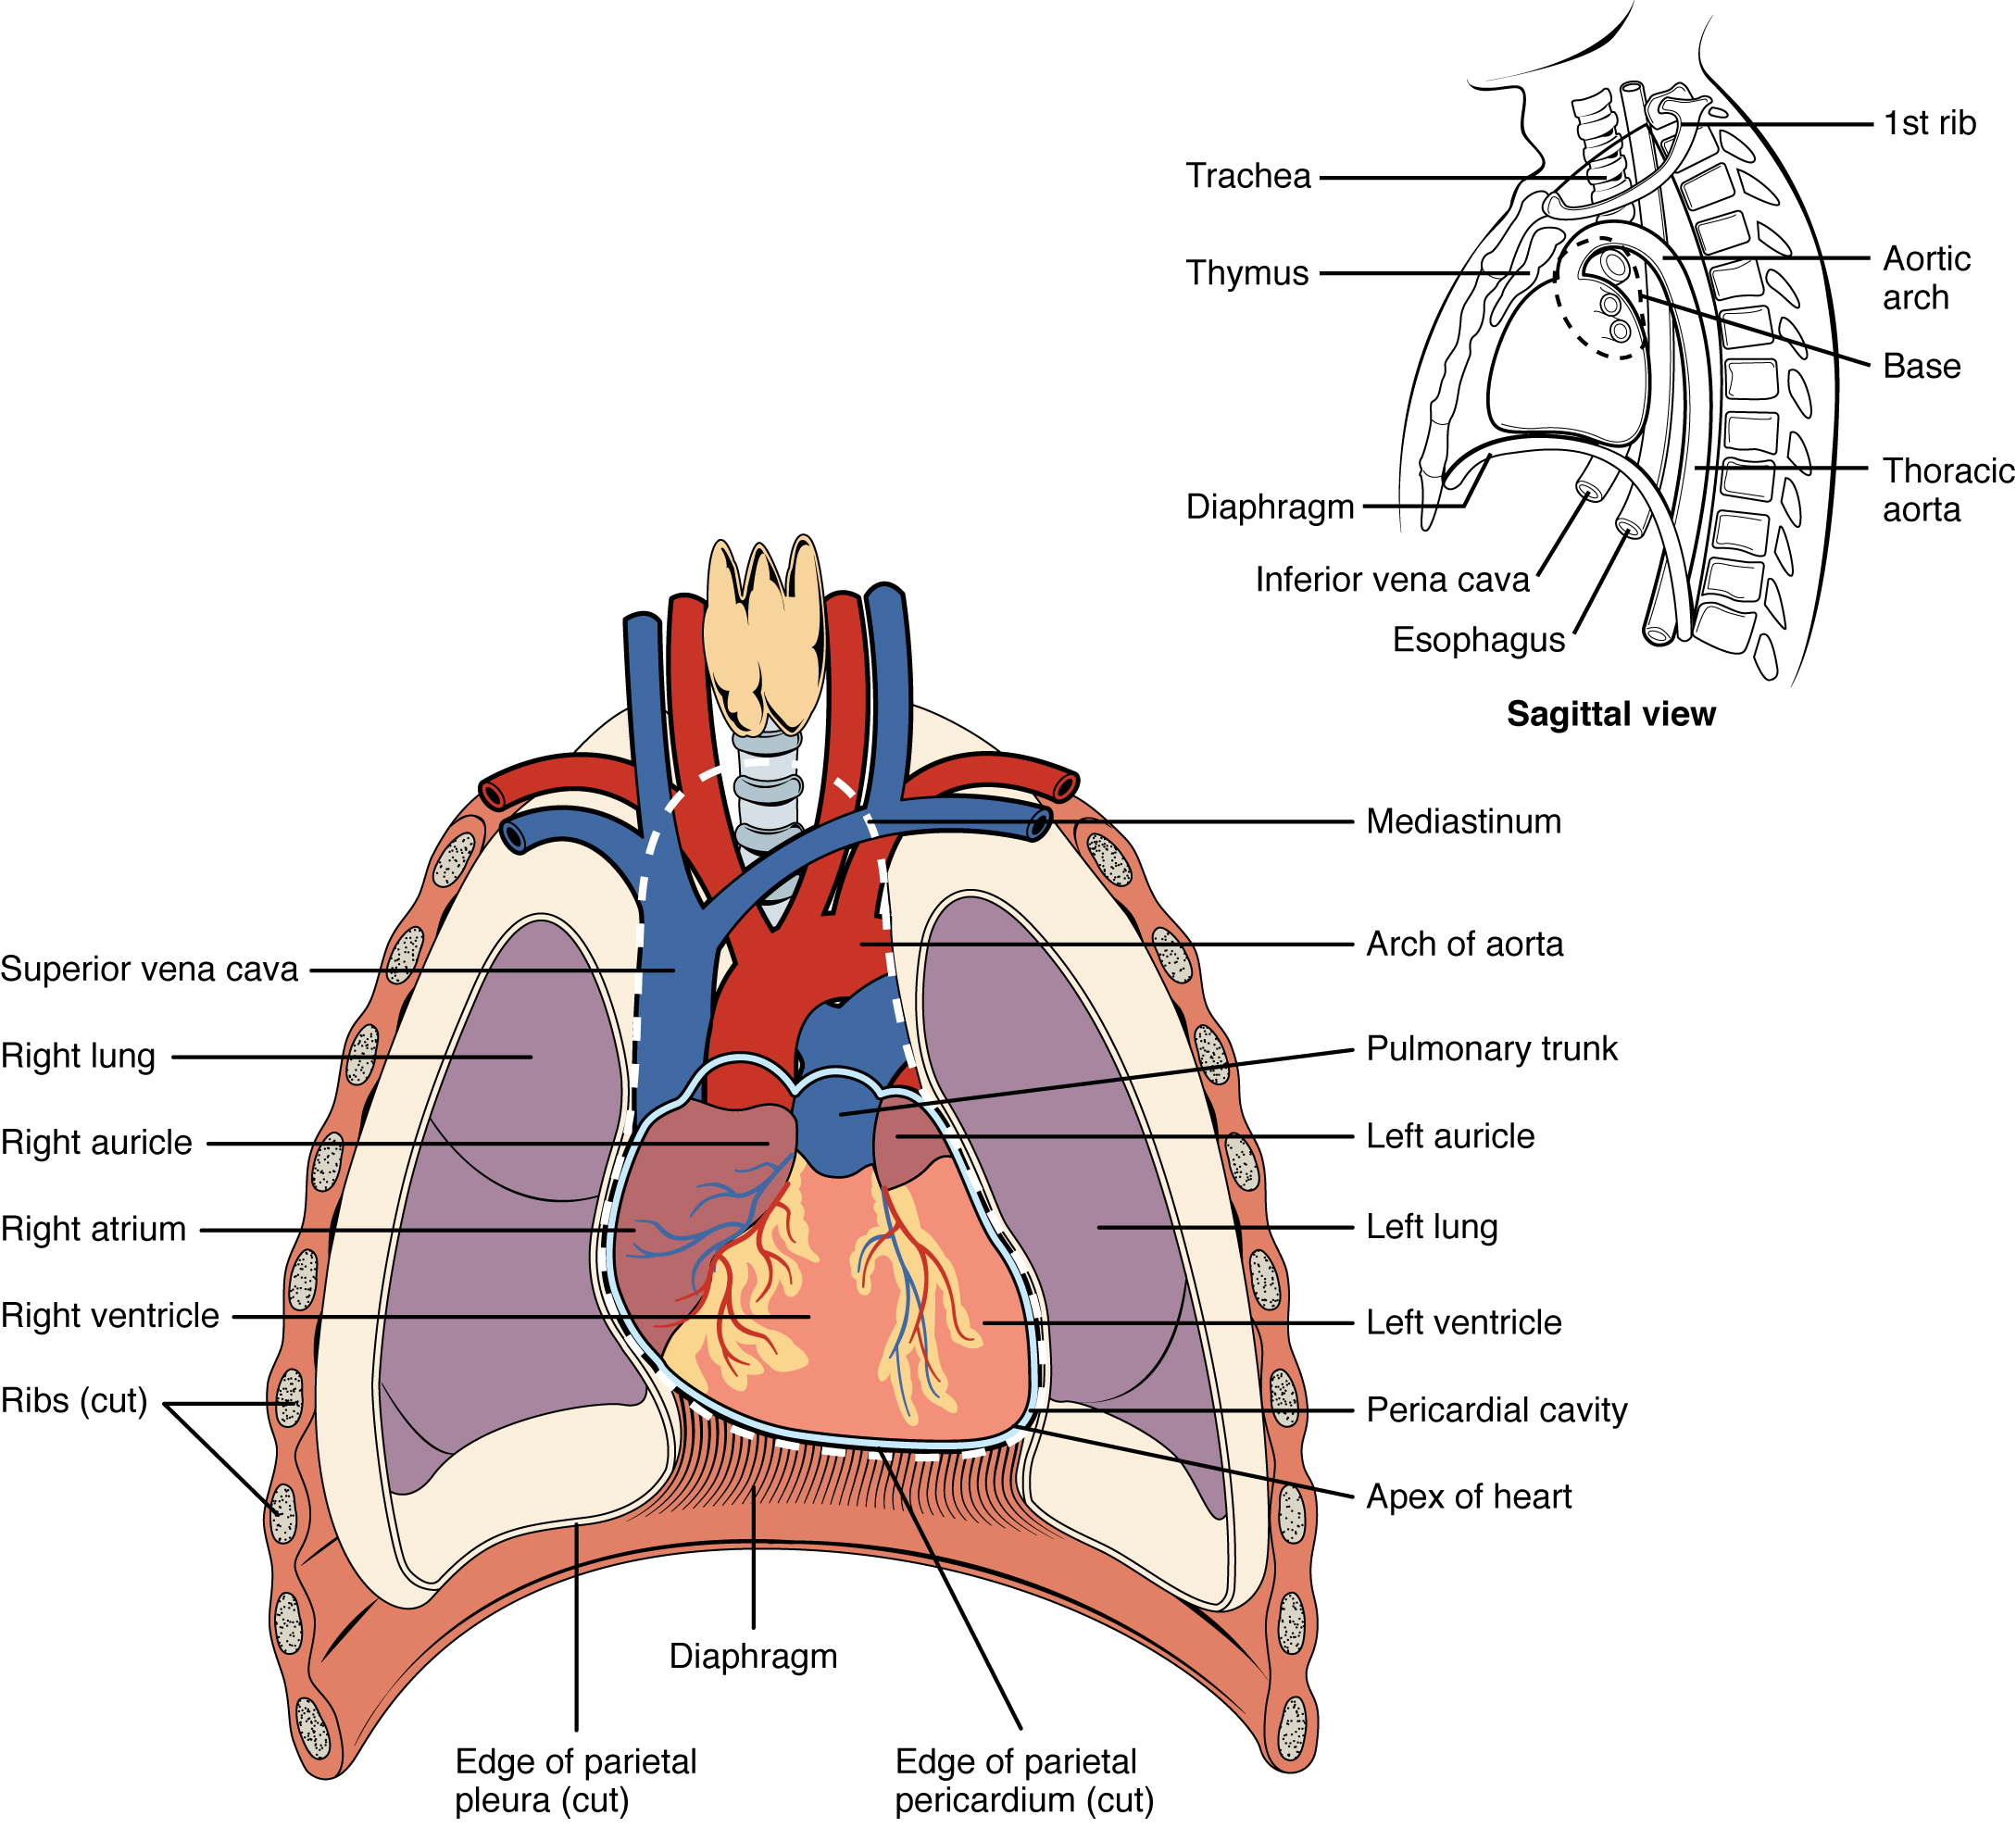
Heart Anatomy. The heart resides within the pericardial sac and is located in the mediastinal space within the thoracic cavity (Figure 19.2).
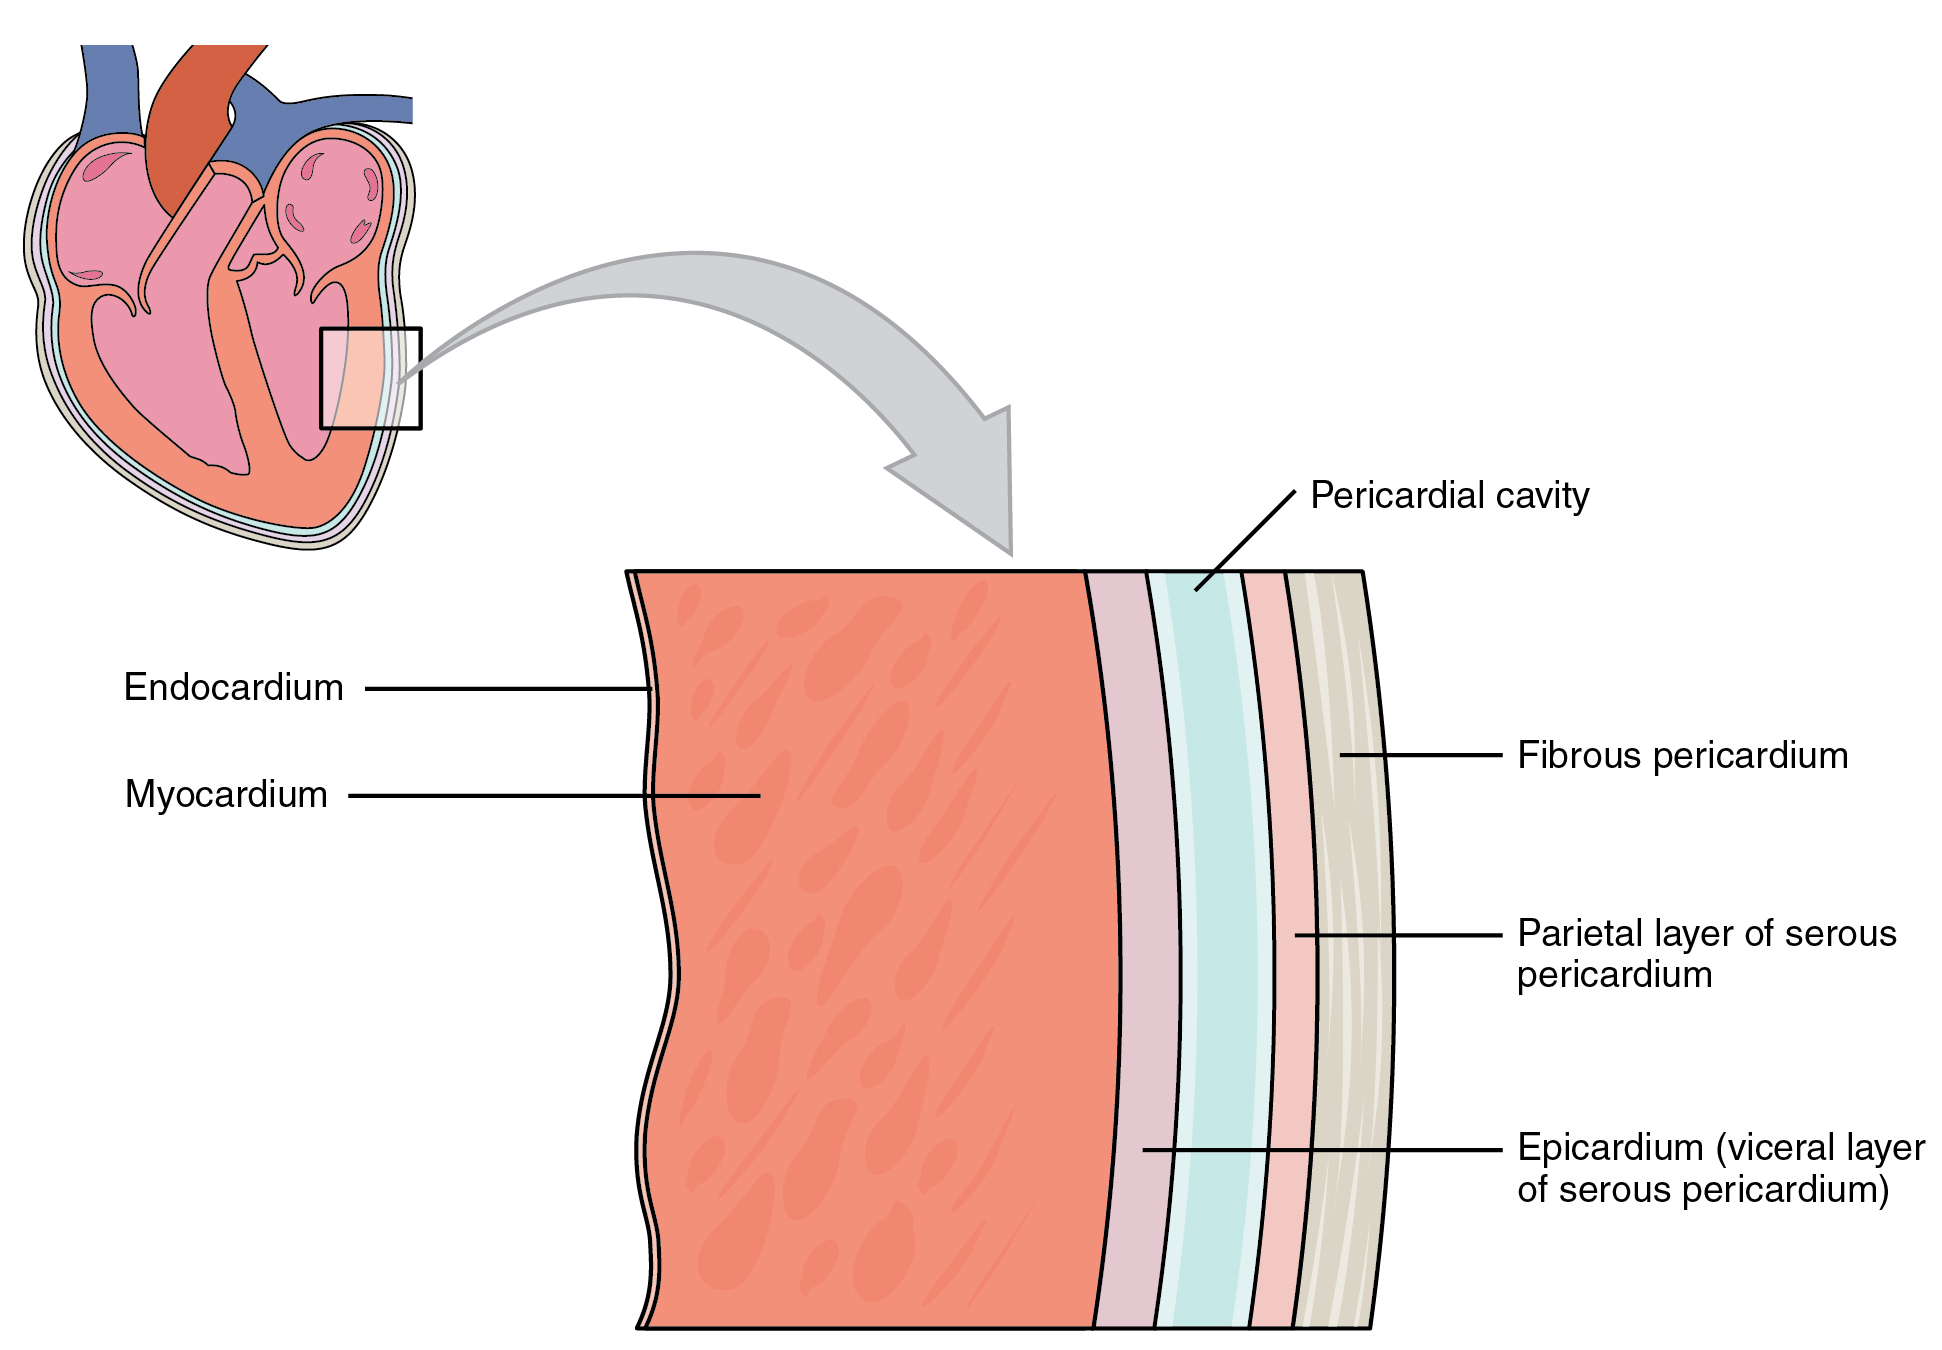
The pericardial sac consists of two fused layers: an outer fibrous capsule and an inner parietal pericardium lined with a serous membrane. Between the pericardial sac and the heart is the pericardial cavity, which is filled with lubricating serous fluid. The walls of the heart are composed of an outer epicardium, a thick myocardium (cardiac muscle layer), and an inner lining layer of endocardium (Figure 19.3).
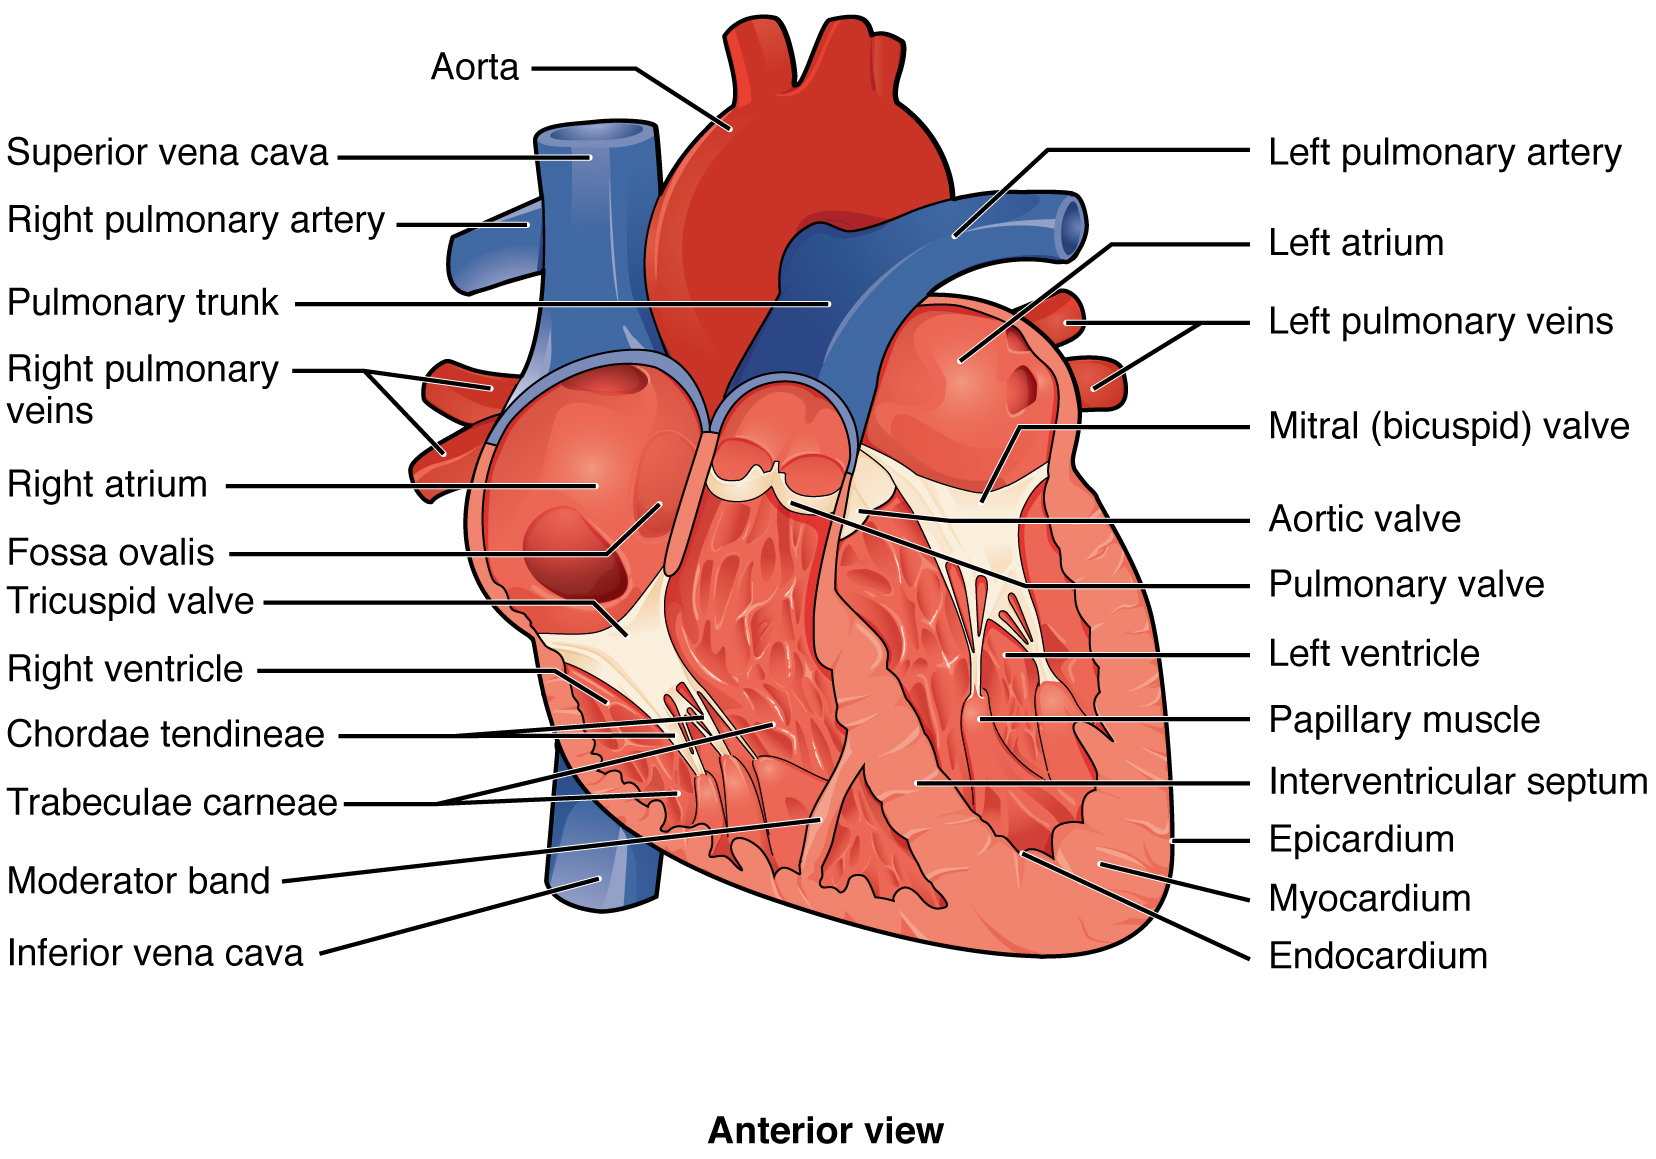
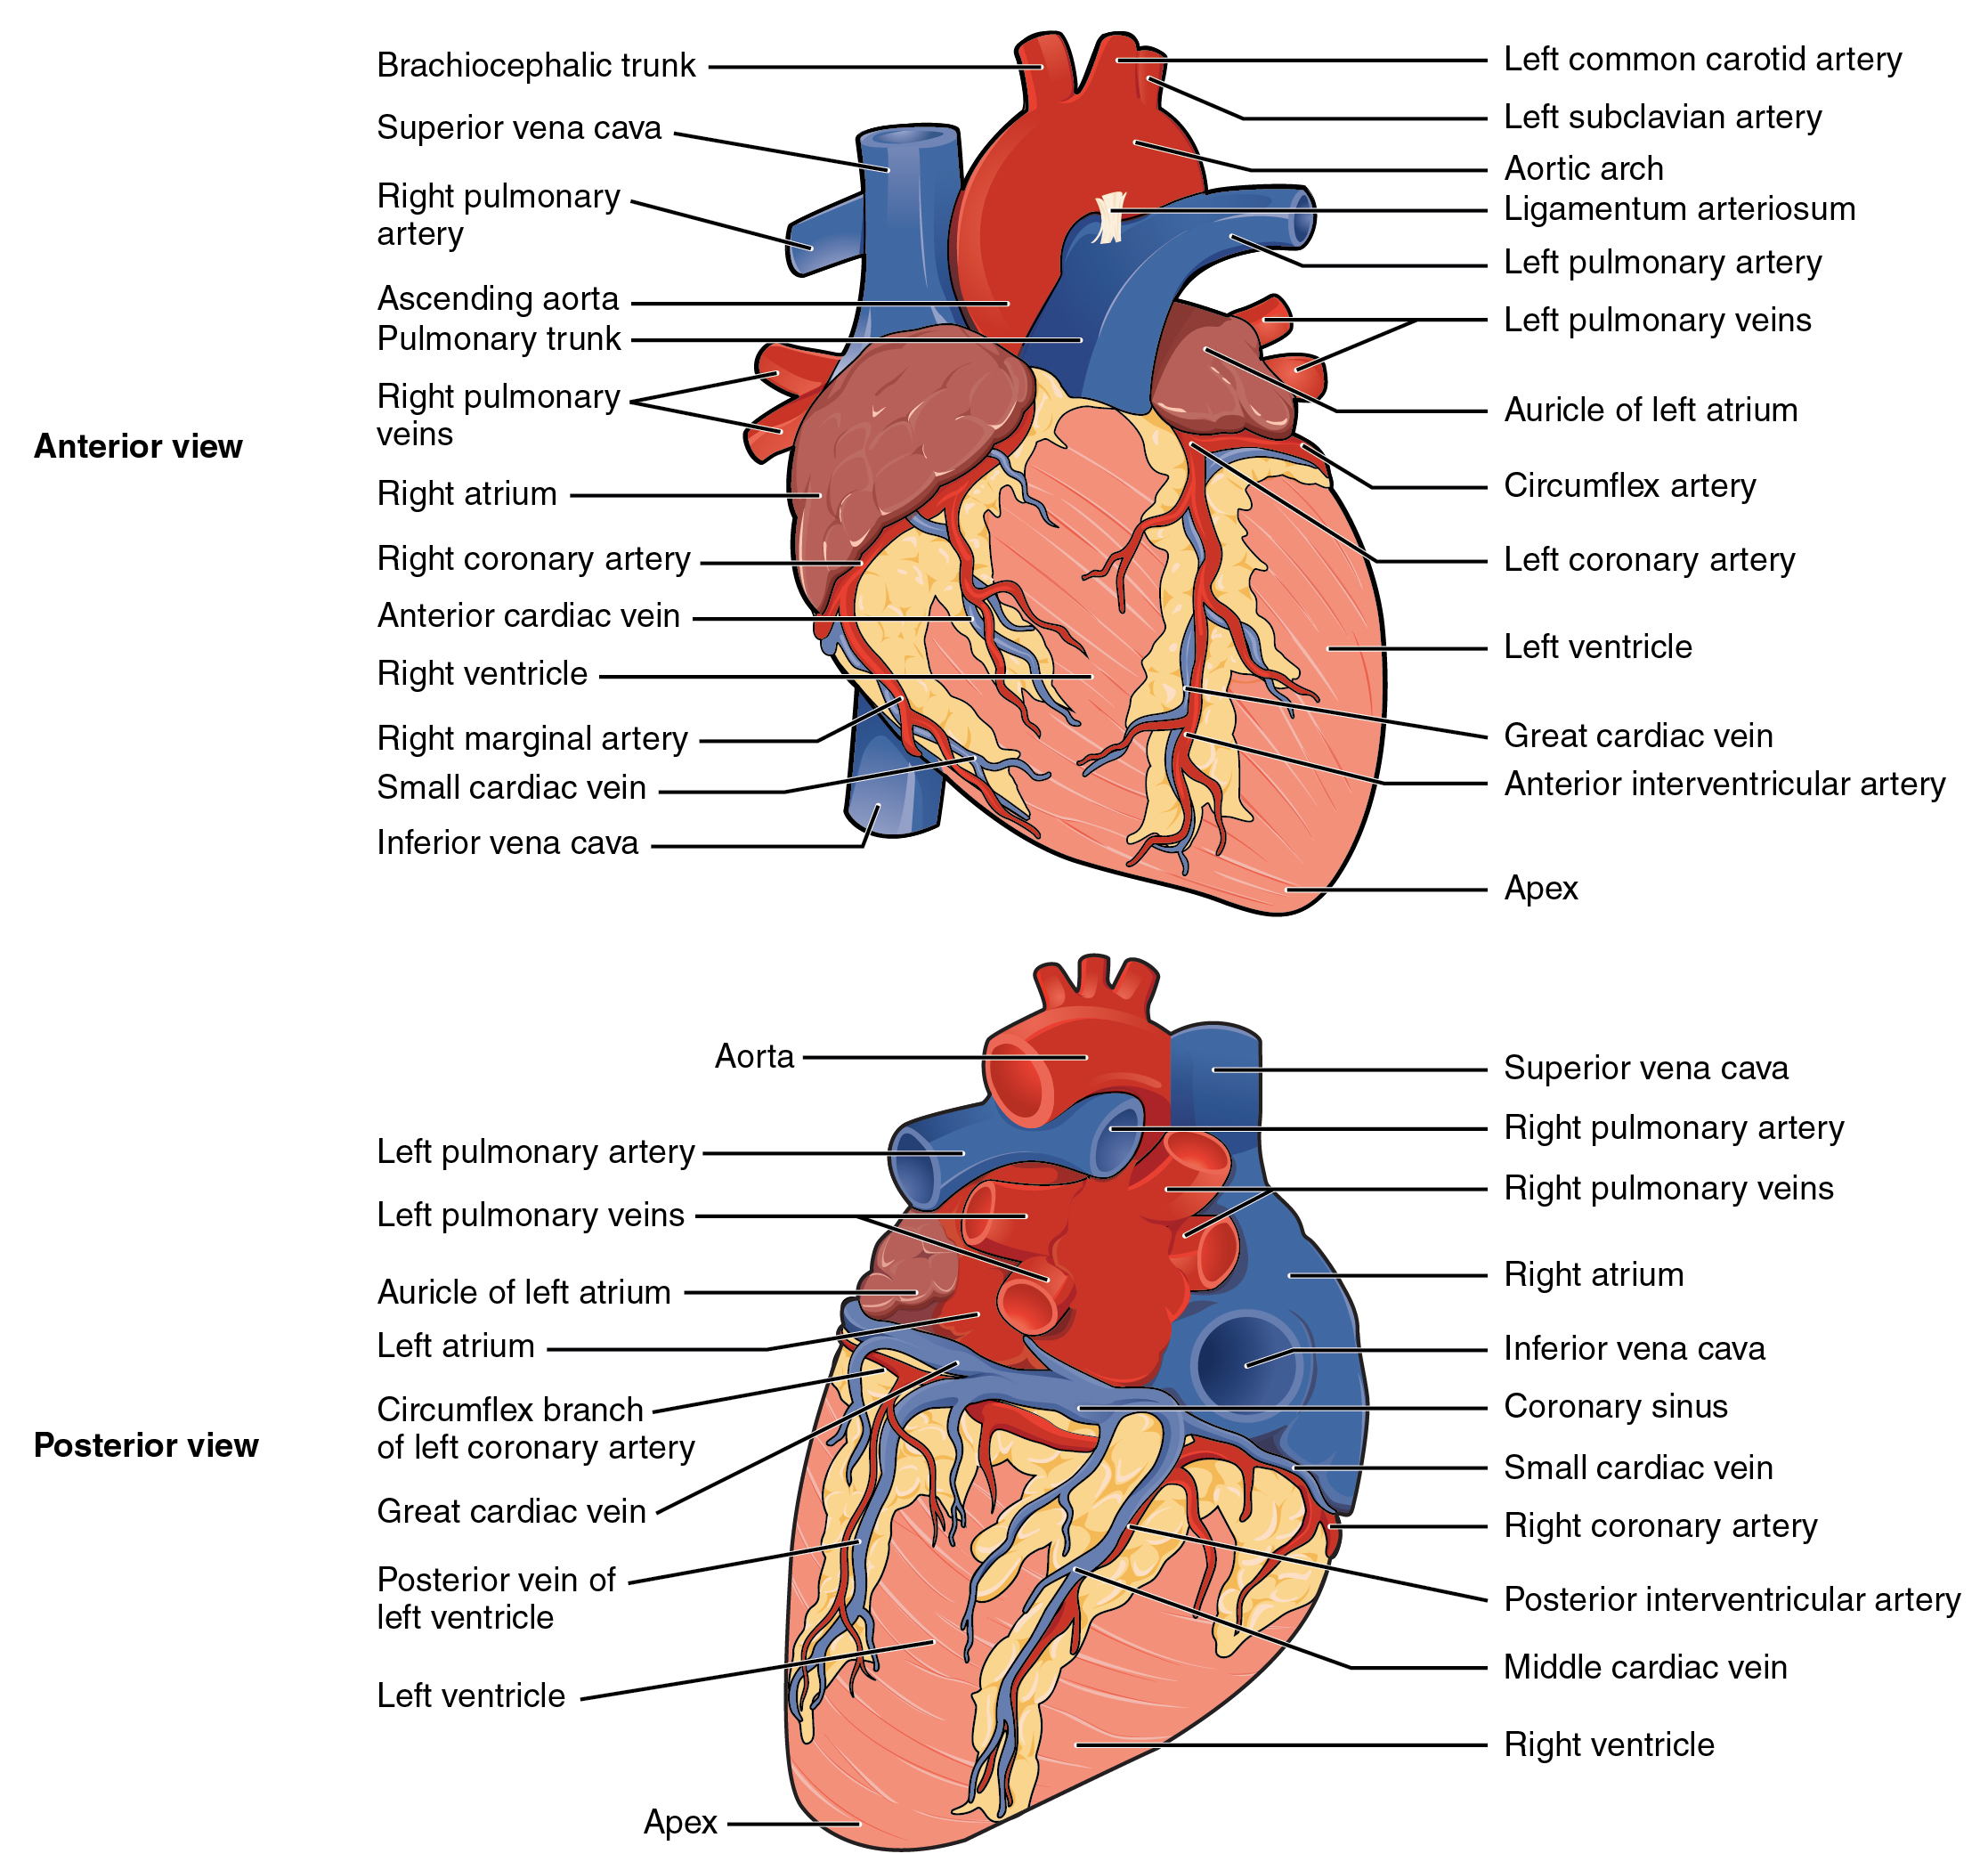
The human heart consists of a pair of atria, which receive blood and pump it into a pair of ventricles, which pump blood into the vessels. The right atrium receives systemic blood relatively low in oxygen and pumps it into the right ventricle, which pumps it into the pulmonary circuit. Exchange of oxygen and carbon dioxide occurs in the lungs, and blood high in oxygen returns to the left atrium, which pumps blood into the left ventricle, which in turn pumps blood into the aorta and the remainder of the systemic circuit. The septa are the partitions that separate the chambers of the heart. They include the interatrial septum, the interventricular septum, and the atrioventricular septum. Two of these openings are guarded by the atrioventricular valves, the right tricuspid valve and the left mitral valve, which prevent the backflow of blood. Each is attached to chordae tendineae that extend to the papillary muscles, which are extensions of the myocardium, to prevent the valves from being blown back into the atria. The pulmonary valve is located at the base of the pulmonary trunk, and the left semilunar valve is located at the base of the aorta (Figure 19.4).
The right and left coronary arteries are the first to branch off the aorta and arise from two of the three sinuses located near the base of the aorta and are generally located in the sulci. Cardiac veins parallel the small cardiac arteries and generally drain into the coronary sinus (Figure 19.5).
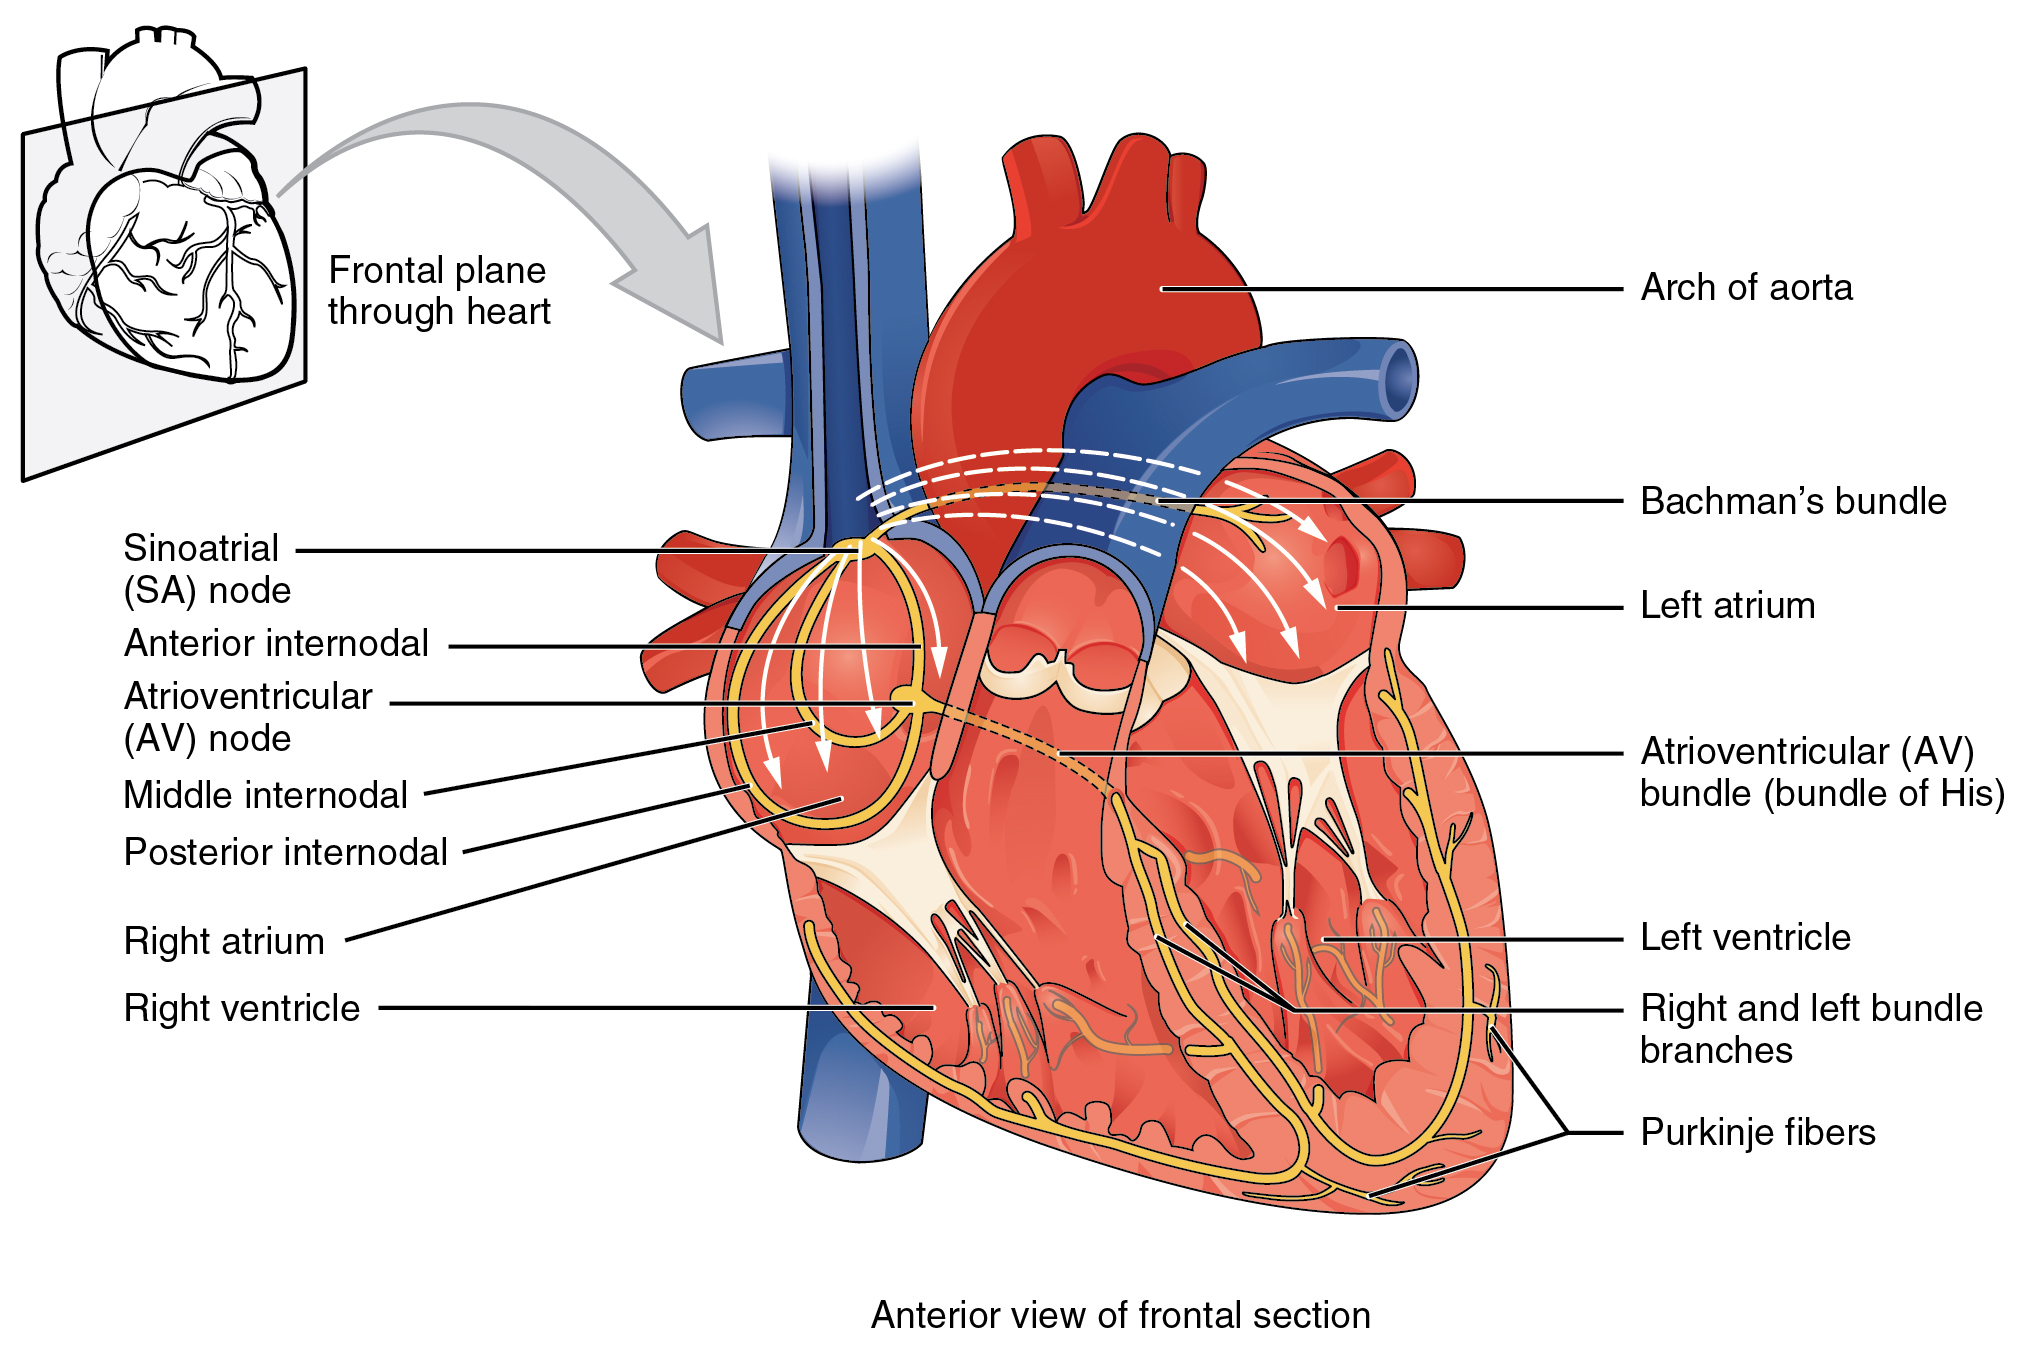
Cardiac Muscle and Electrical Activity. The heart is regulated by both neural and endocrine control, yet it is capable of initiating its own action potential followed by muscular contraction. The conductive cells within the heart establish the heart rate and transmit it through the myocardium (cardiac muscle). The contractile cells (cardiac muscle cells) contract and propel the blood. The normal path of transmission for the conductive cells is the sinoatrial (SA) node, internodal pathways, atrioventricular (AV) node, atrioventricular (AV) bundle of His, bundle branches, and Purkinje fibers (Figure 19.6).
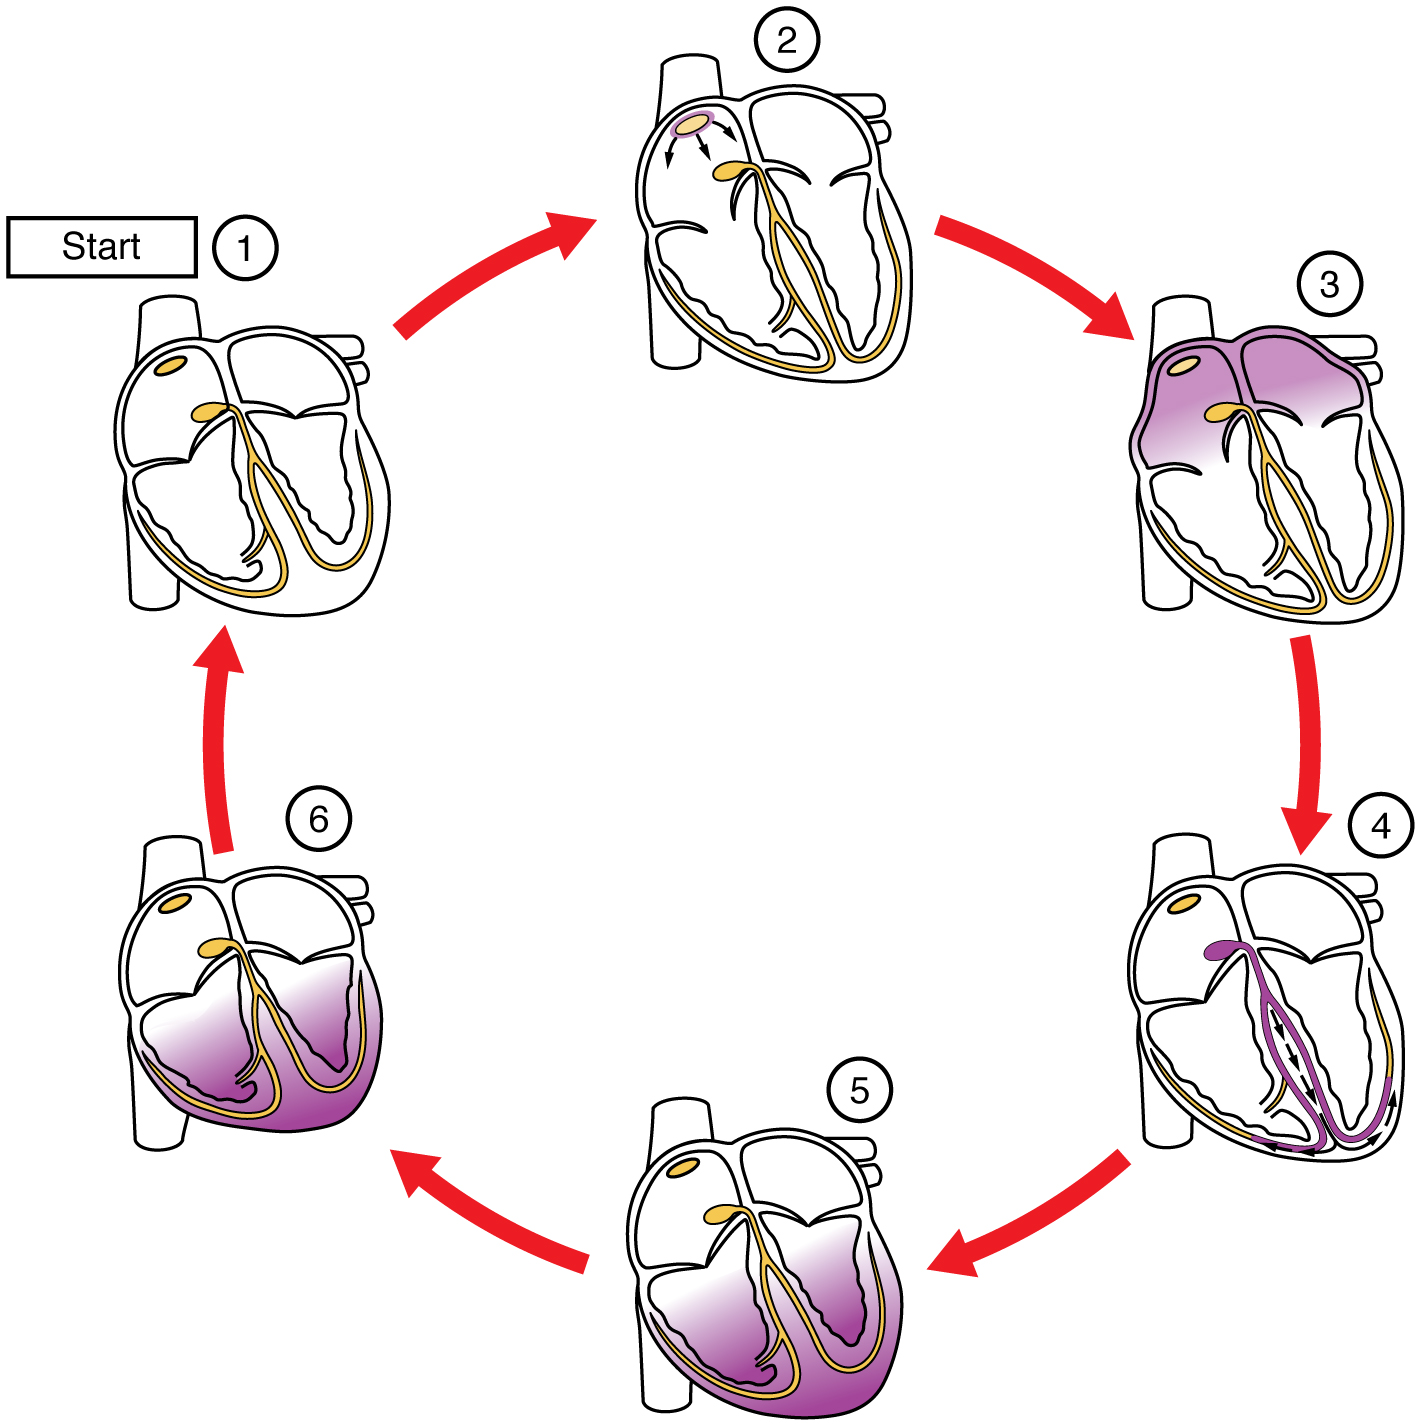
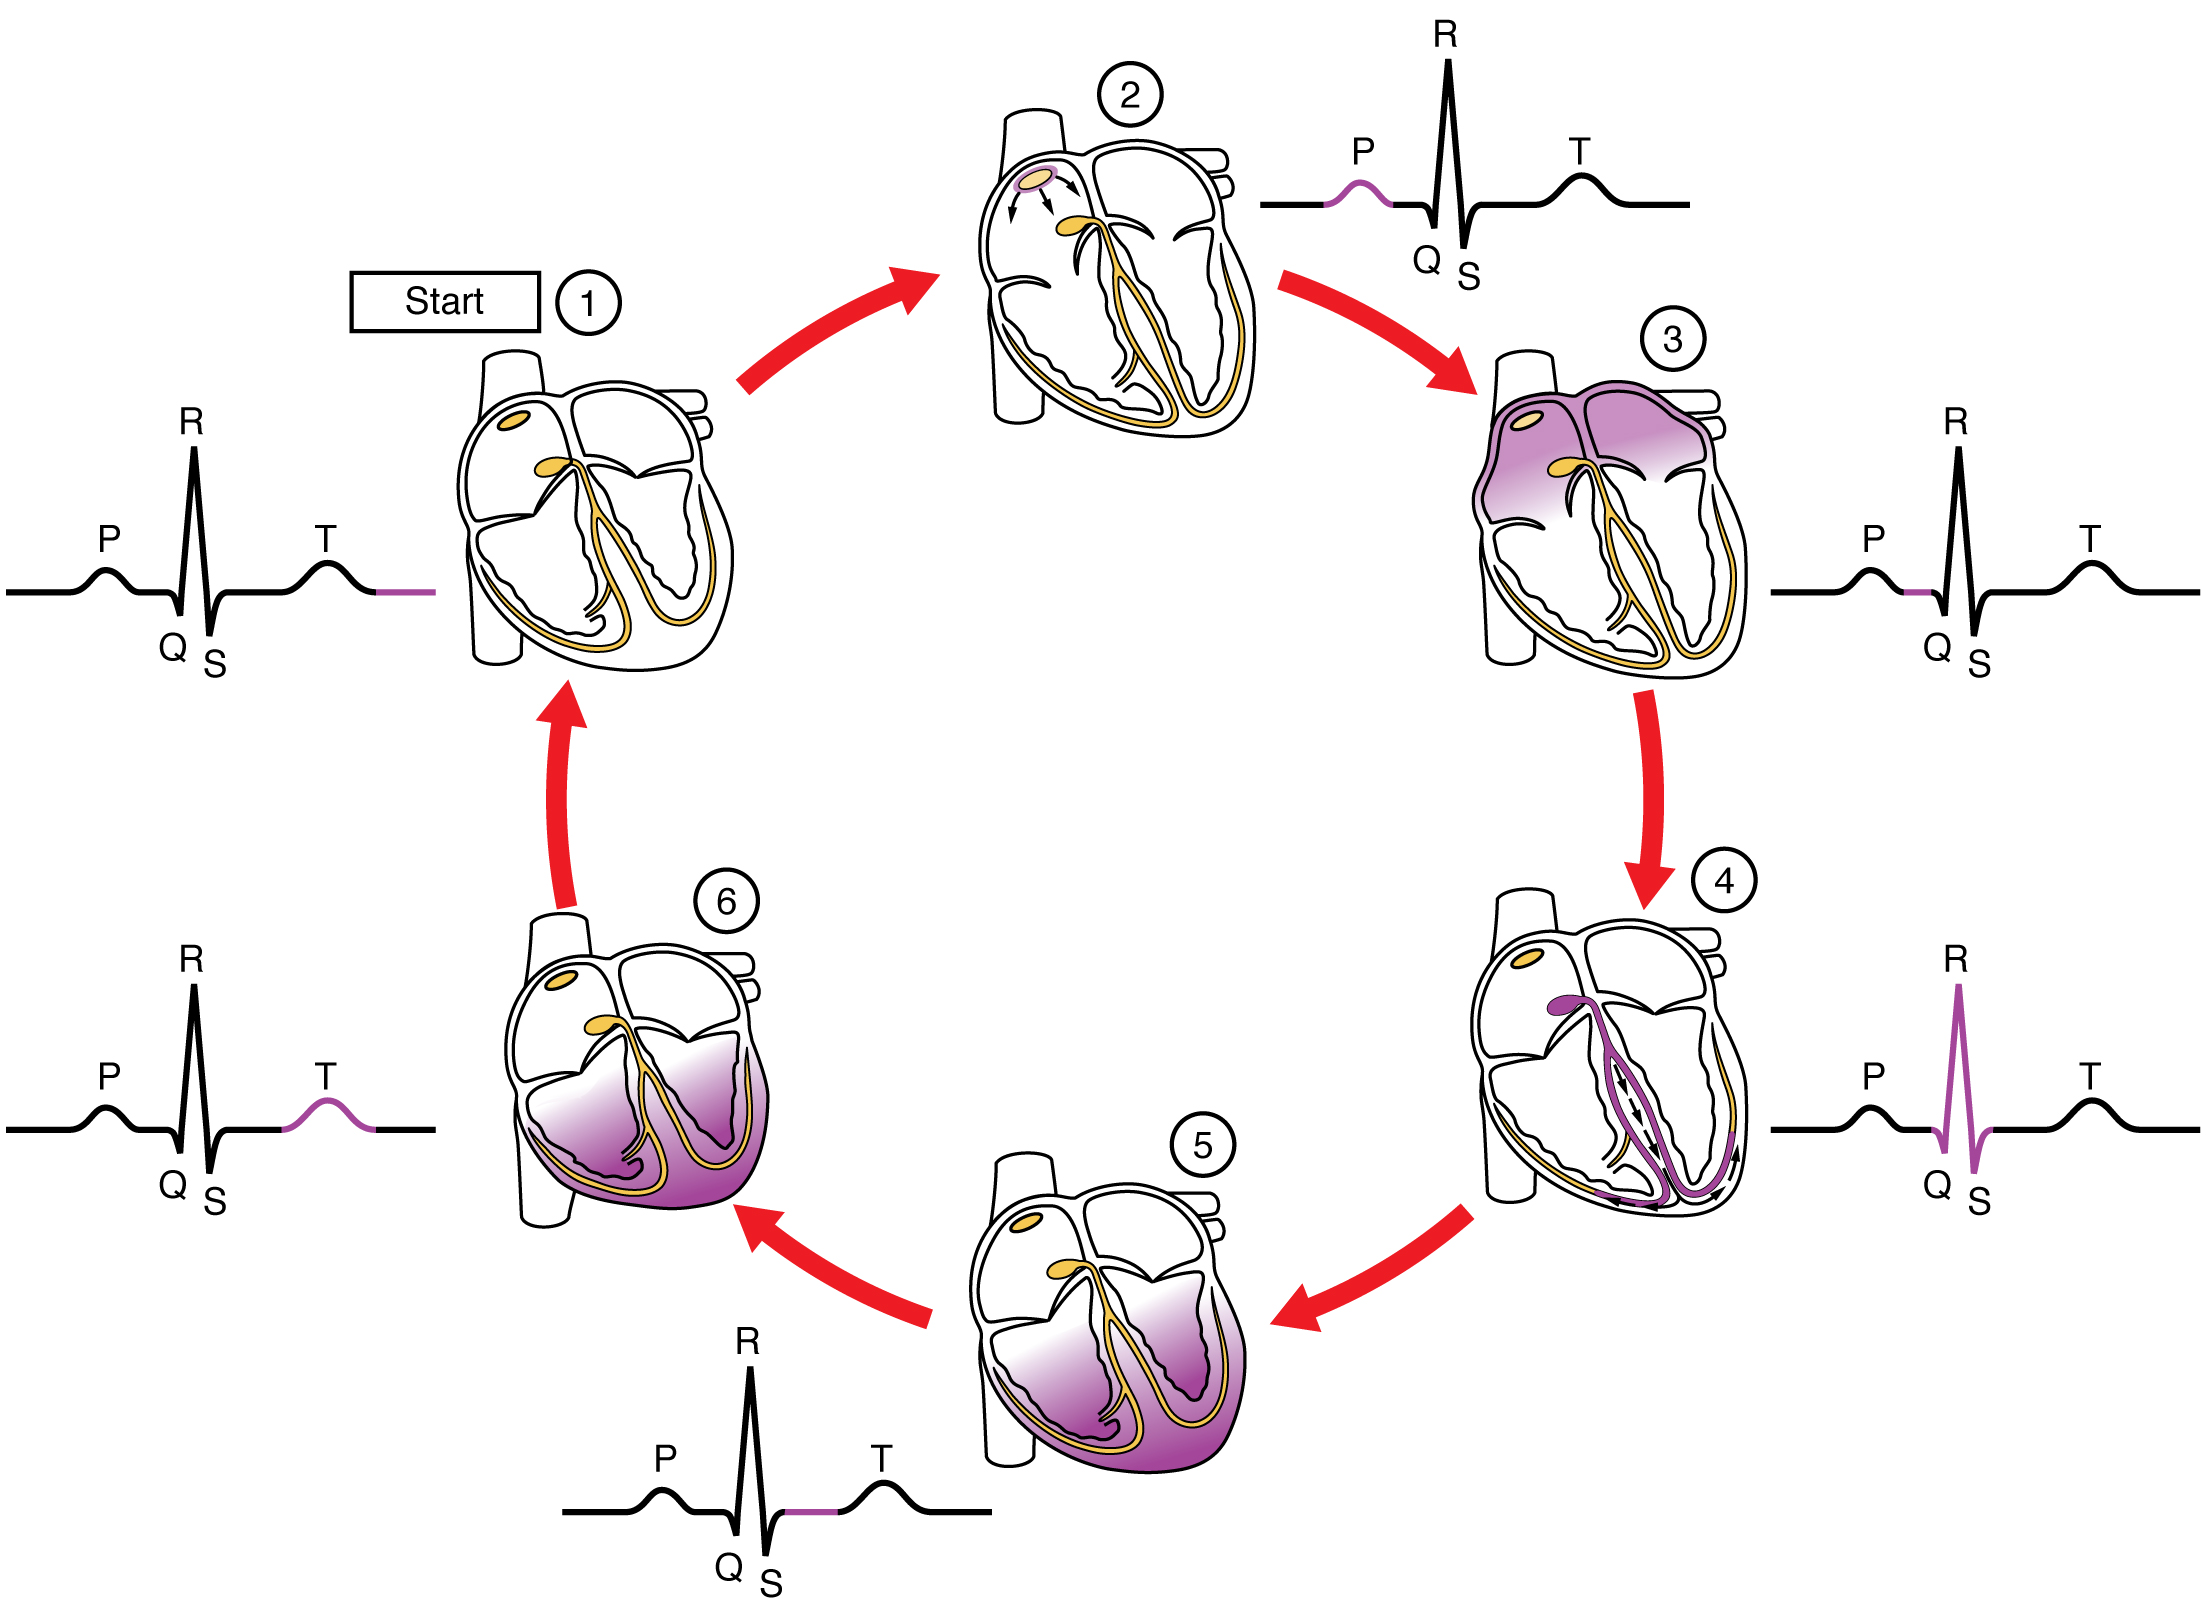
Cardiac conduction occurs in a cycle starting with the SA node that initiates atrial contraction. The electrical signal then is passed to the AV node and AV bundle and Purkinje fibers to initiate ventricular contraction. As the ventricular contraction is initiated, the atria relax (Figure 19.7).
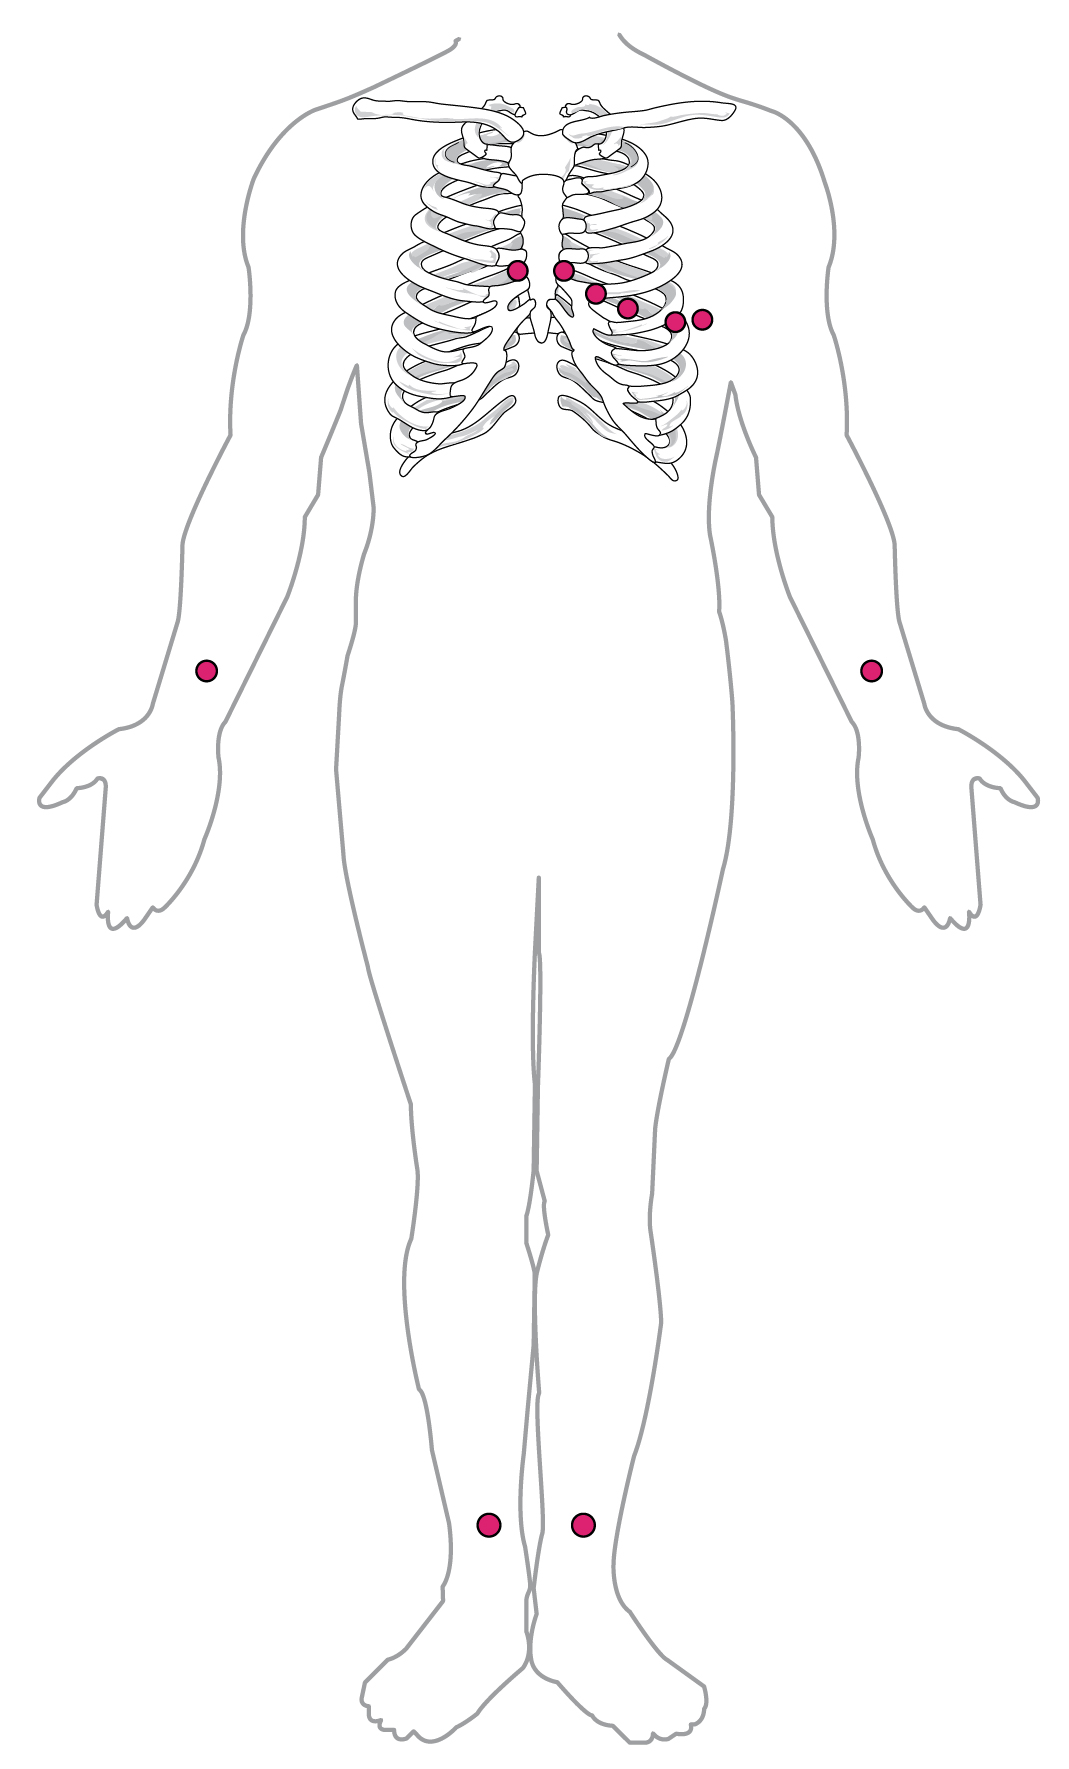
The Electrocardiogram (ECG) is used to record the electrical signals generated by the heart’s conducting cells (SA node, AV node, AV bundle, Purkinje cells) and contracting cells (myocardium or cardiac muscle cells). Electrodes are placed as shown in Figure 19.8 and the recorded traces are used to distinguish normal and abnormal heart function.
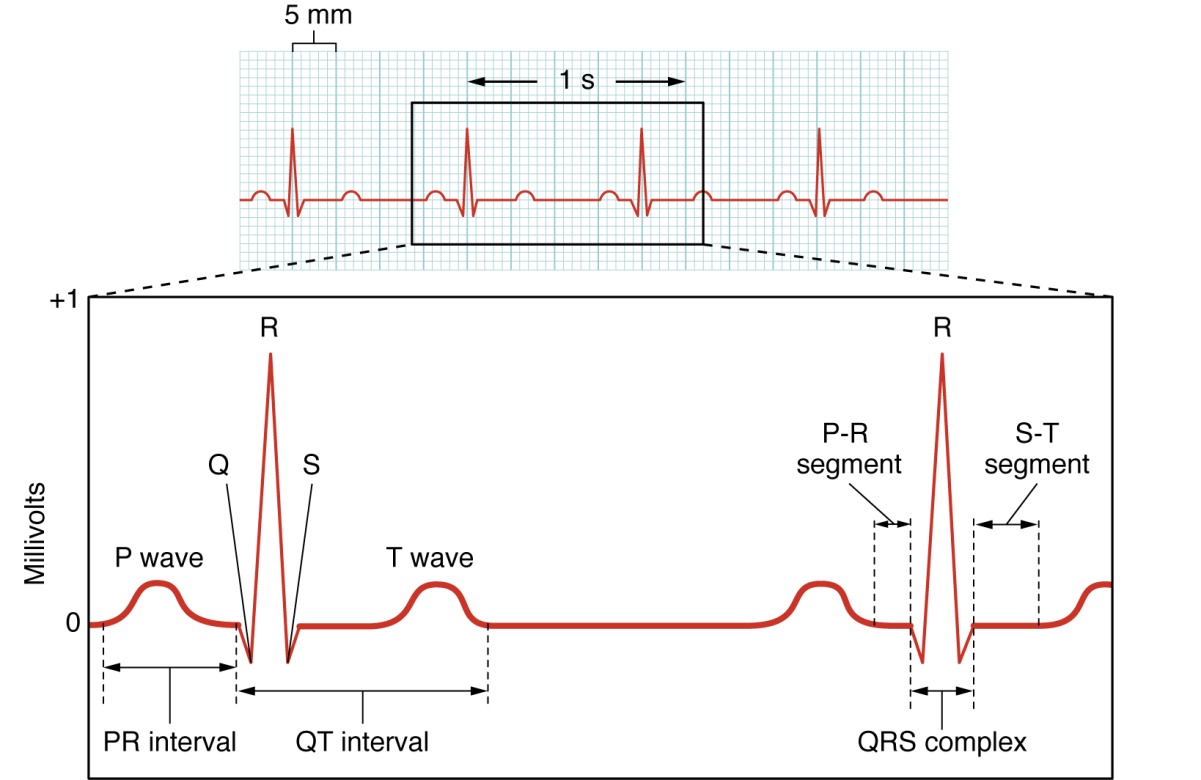
Recognizable points on the ECG include the P wave that corresponds to atrial depolarization, the QRS complex that corresponds to ventricular depolarization, and the T wave that corresponds to ventricular repolarization (Figures 19.9 and 19.10).
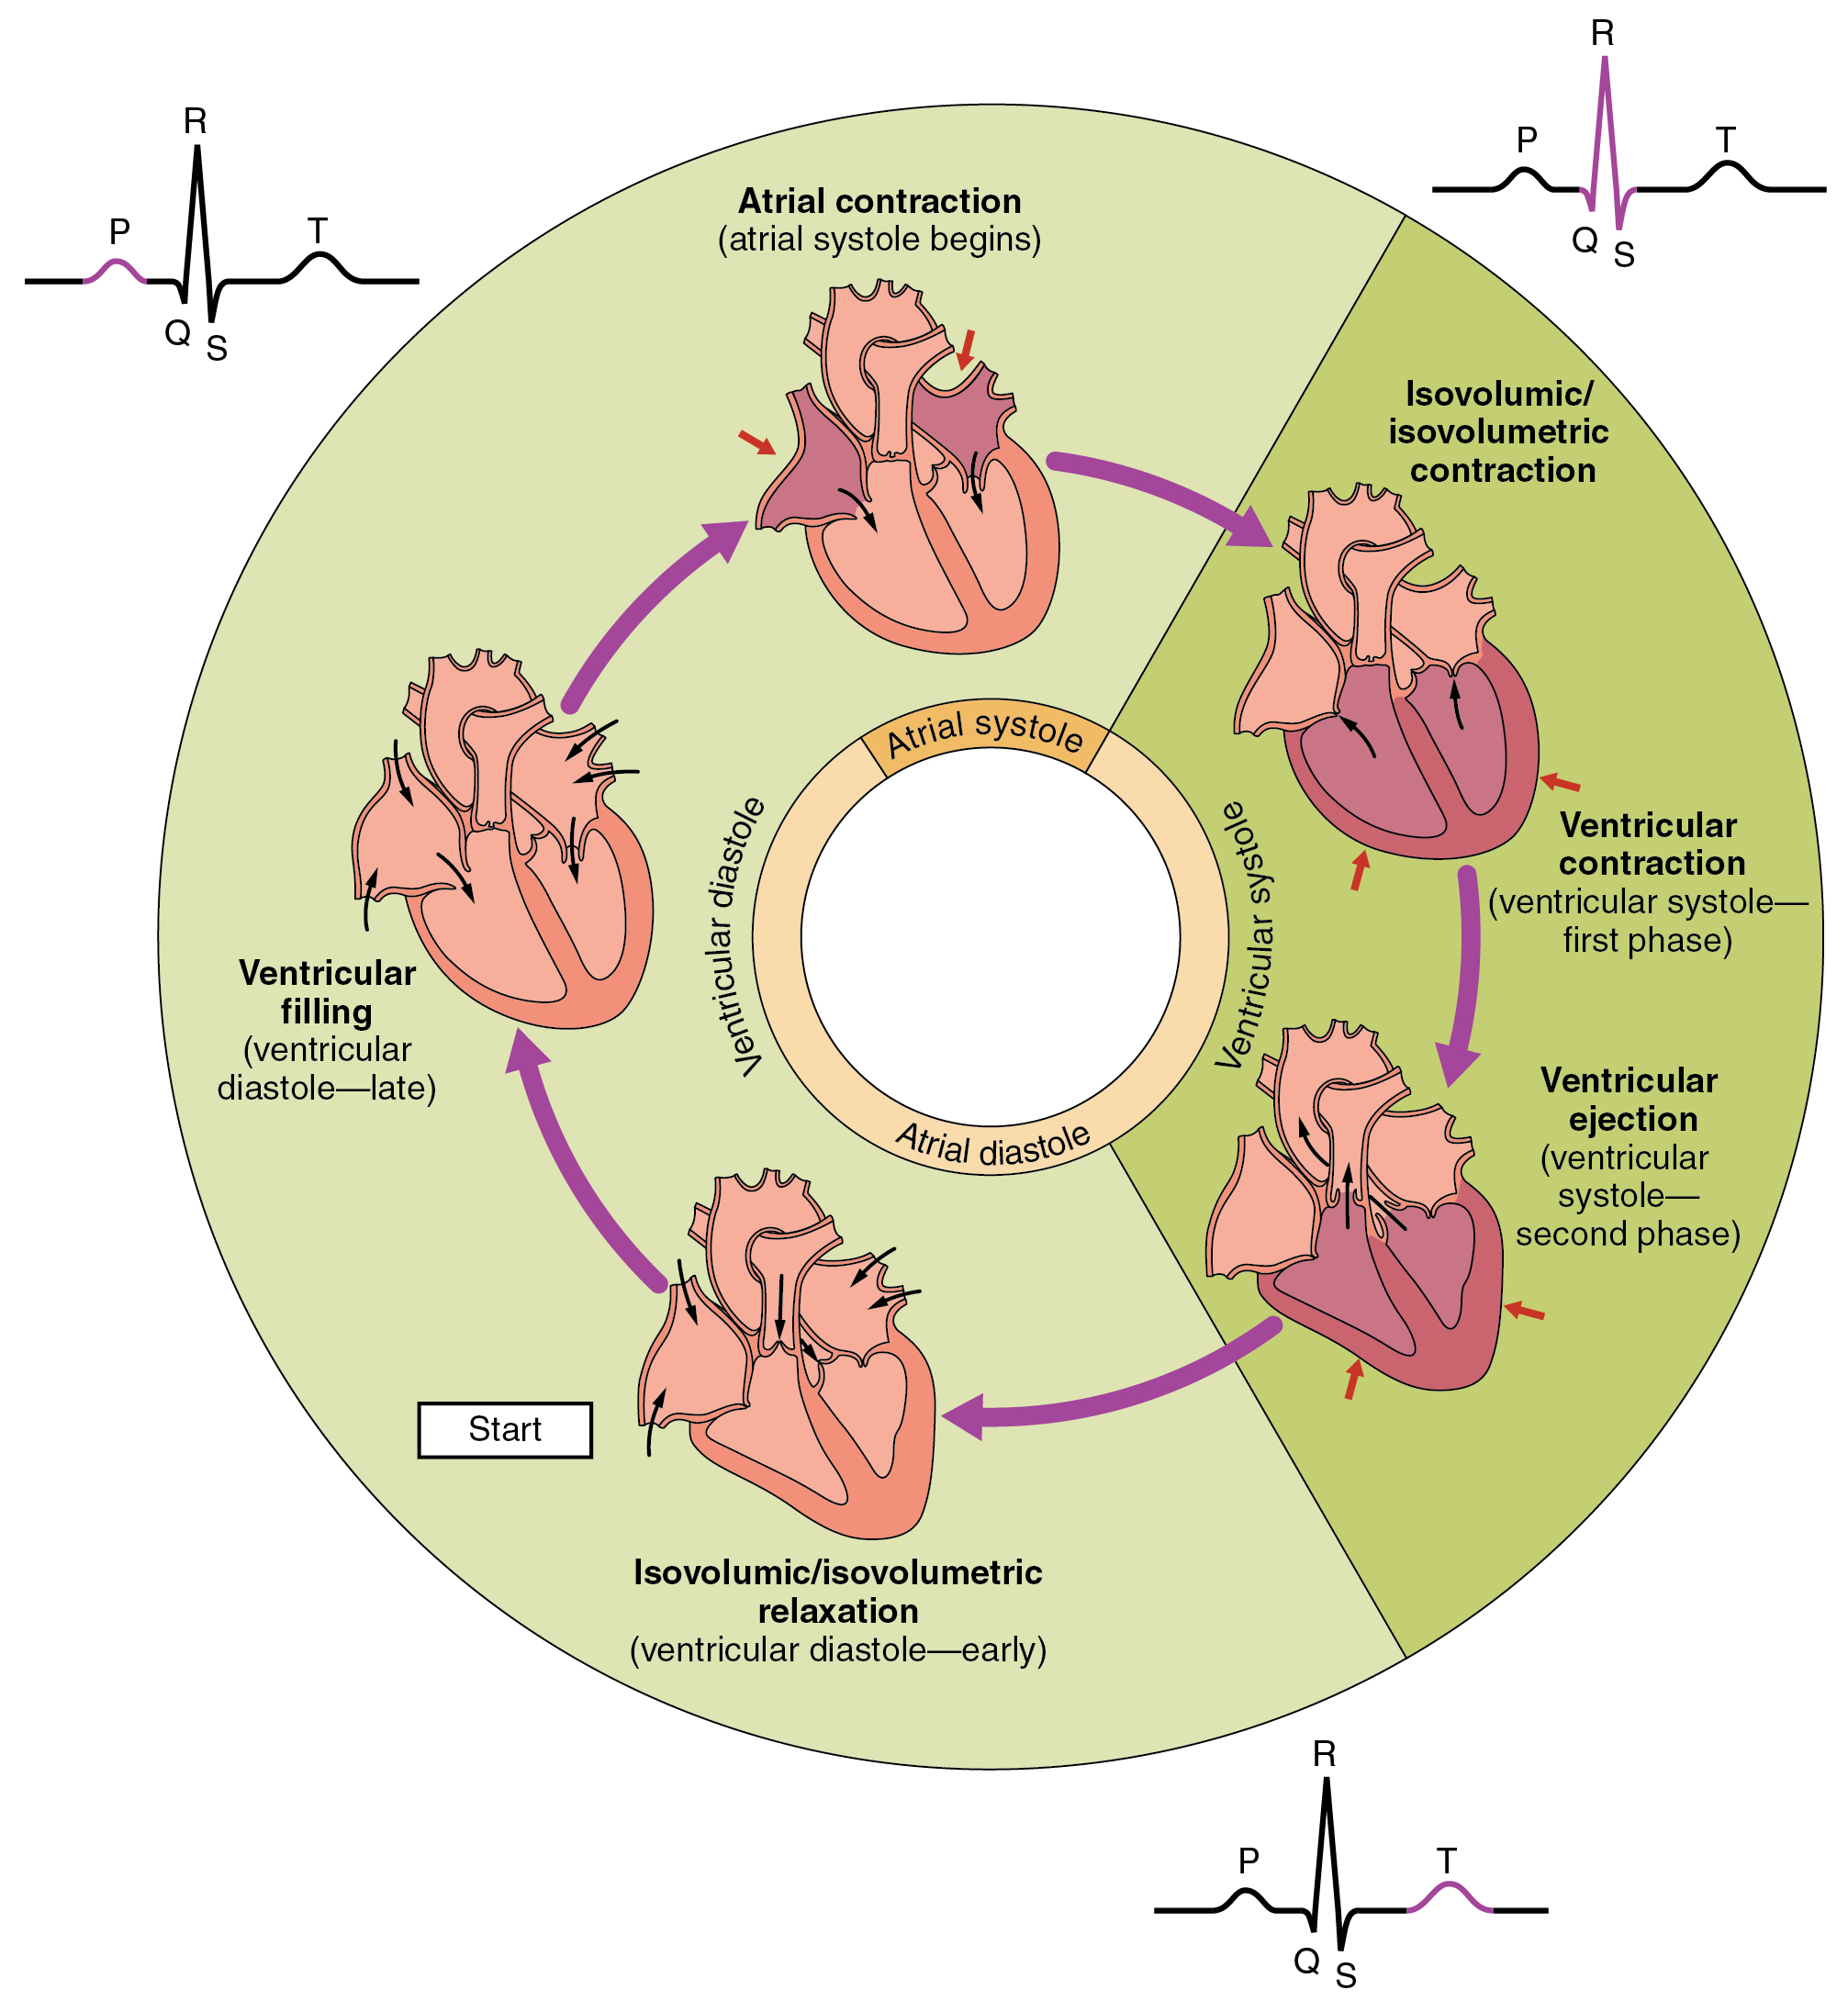
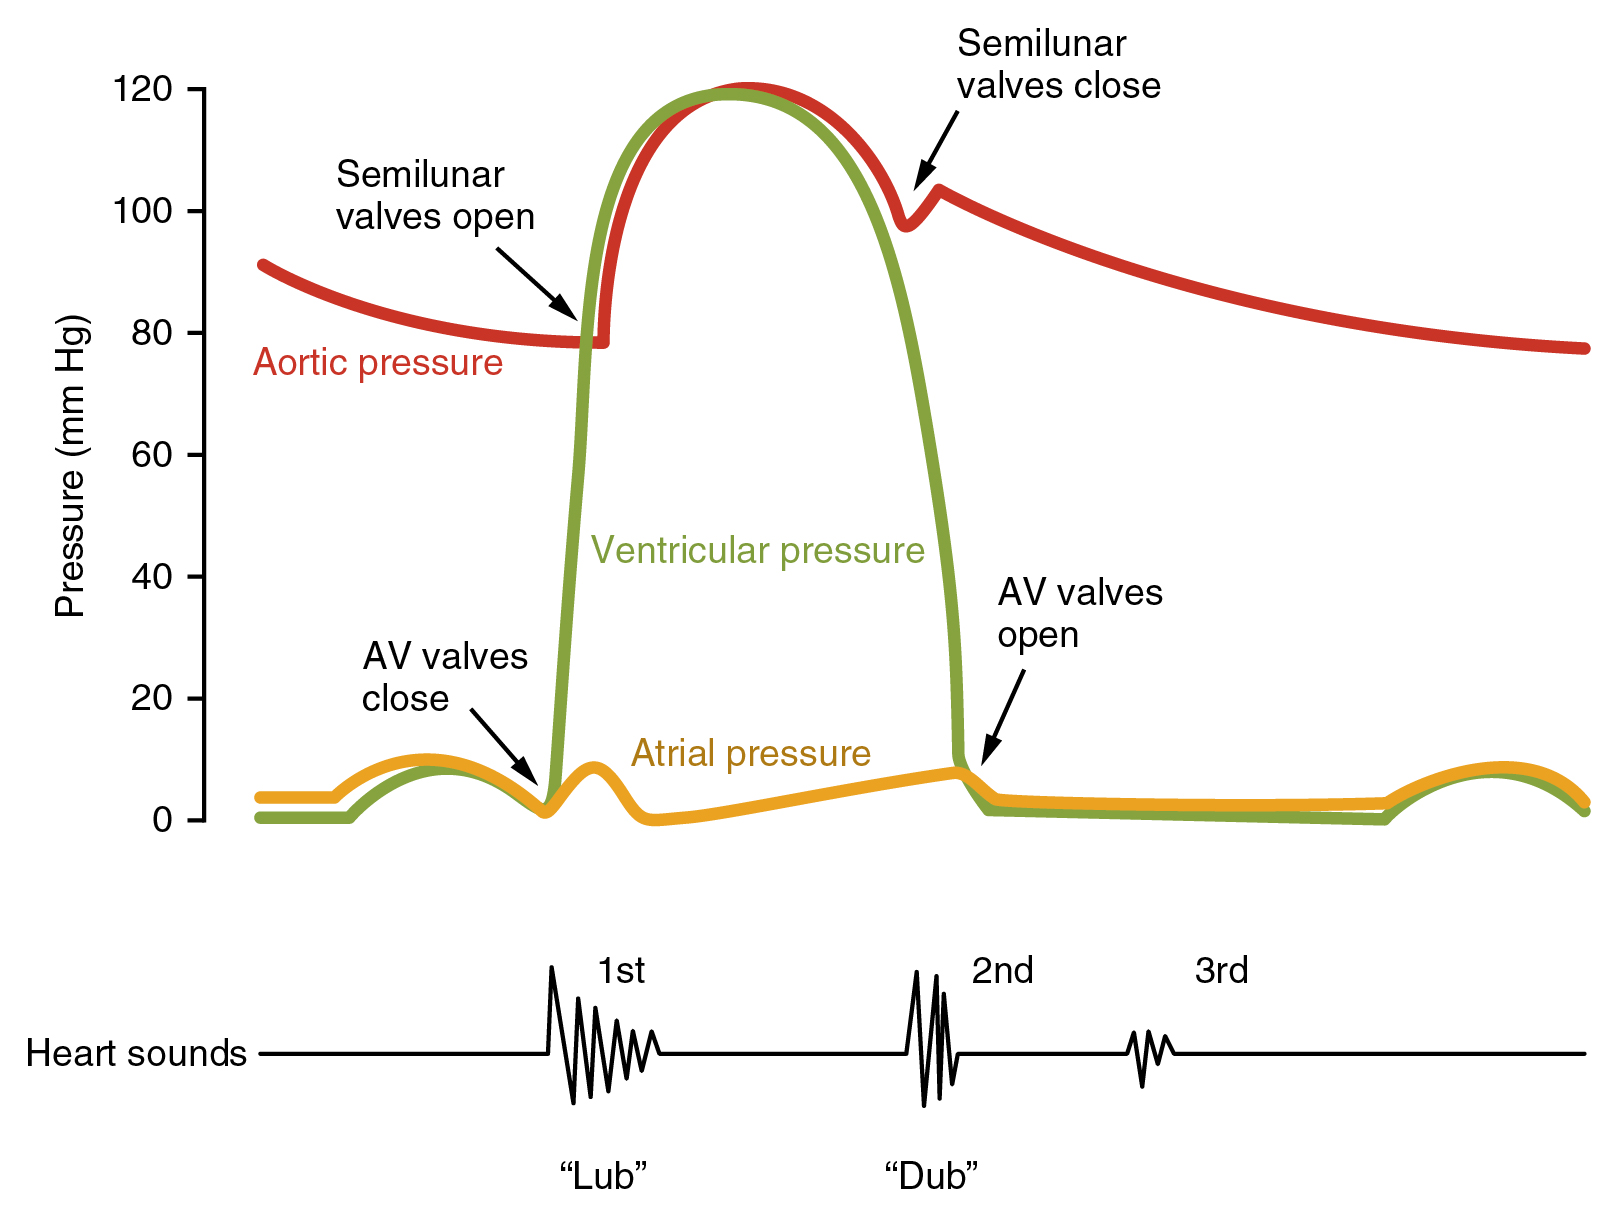
Cardiac Cycle. The cardiac cycle comprises a complete relaxation and contraction of both the atria and ventricles, and lasts approximately 0.8 seconds. Beginning with all chambers in diastole (relaxation), blood flows passively from the veins into the atria and past the atrioventricular valves into the ventricles. The atria begin to contract (atrial systole), following depolarization of the atria, and pump blood into the ventricles. The ventricles begin to contract (ventricular systole), raising pressure within the ventricles. When ventricular pressure rises above the pressure in the atria, blood flows toward the atria, producing the first heart sound, S1 or lub. As pressure in the ventricles rises above two major arteries, blood pushes open the two semilunar valves and moves into the pulmonary trunk and aorta in the ventricular ejection phase. Following ventricular repolarization, the ventricles begin to relax (ventricular diastole), and pressure within the ventricles drops. As ventricular pressure drops, there is a tendency for blood to flow back into the atria from the major arteries, producing the dicrotic notch in the ECG and closing the two semilunar valves. The second heart sound, S2 or dub, occurs when the semilunar valves close. When the ventricular pressure falls below that of the atria, blood moves from the atria into the ventricles, opening the atrioventricular valves and marking one complete heart cycle (Figure 19.11).
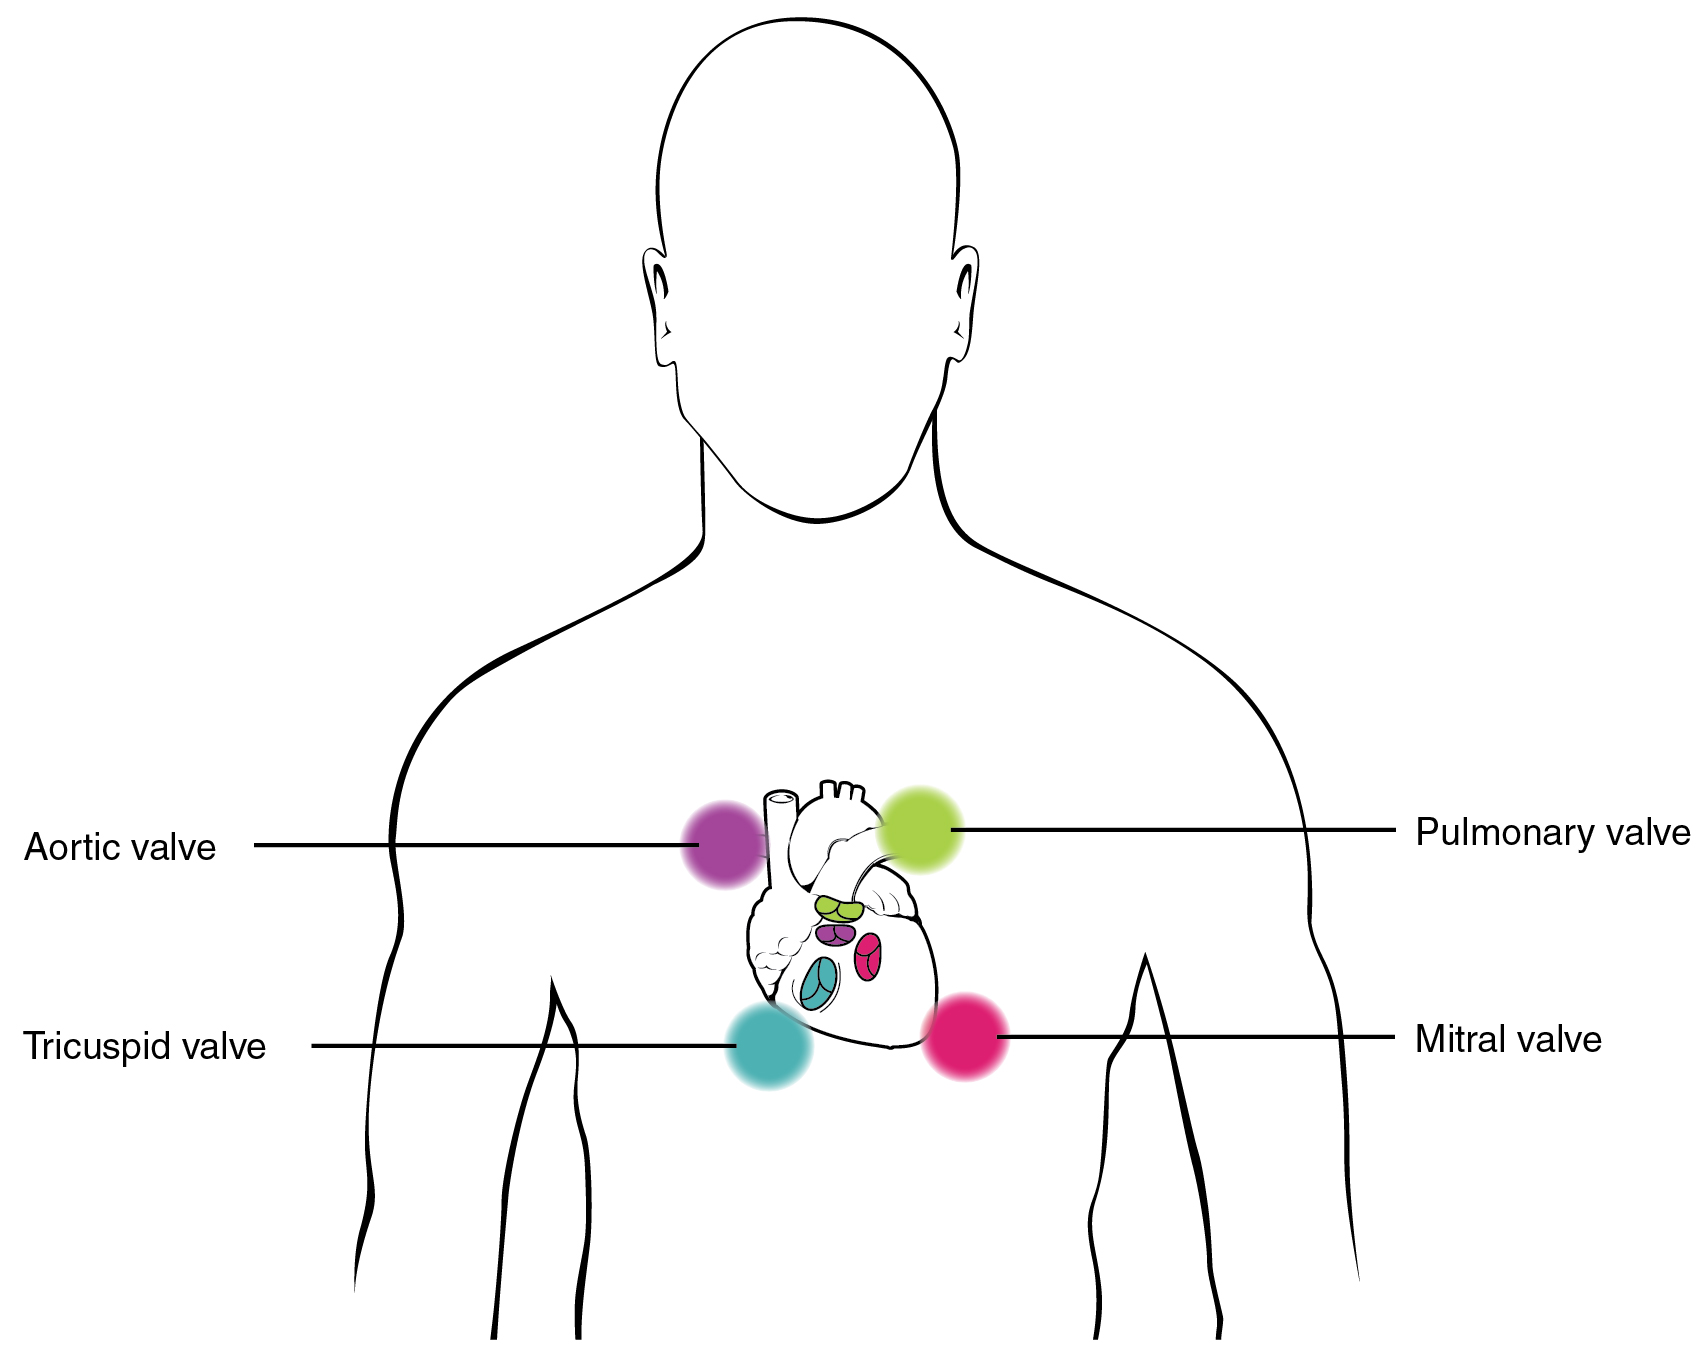
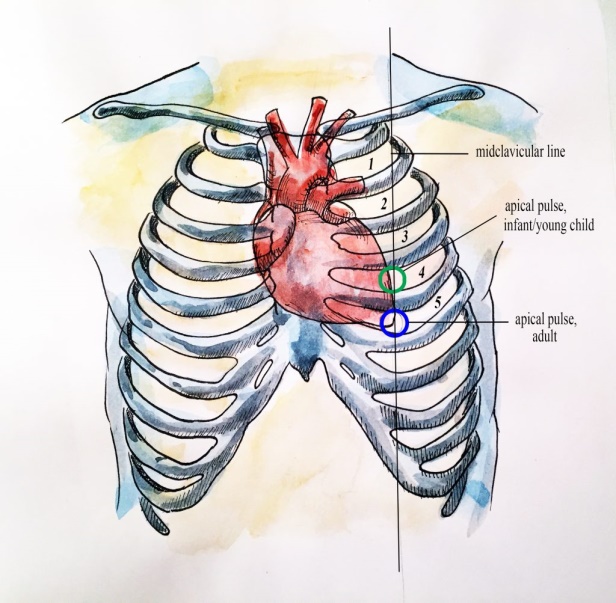
The valves prevent backflow of blood. Failure of the valves to operate properly produces turbulent blood flow within the heart; the resulting heart murmur can often be heard with a stethoscope. Normal and abnormal heart sounds can be heard using a stethoscope and a method called auscultation (Figure 19.12 and 19.13).
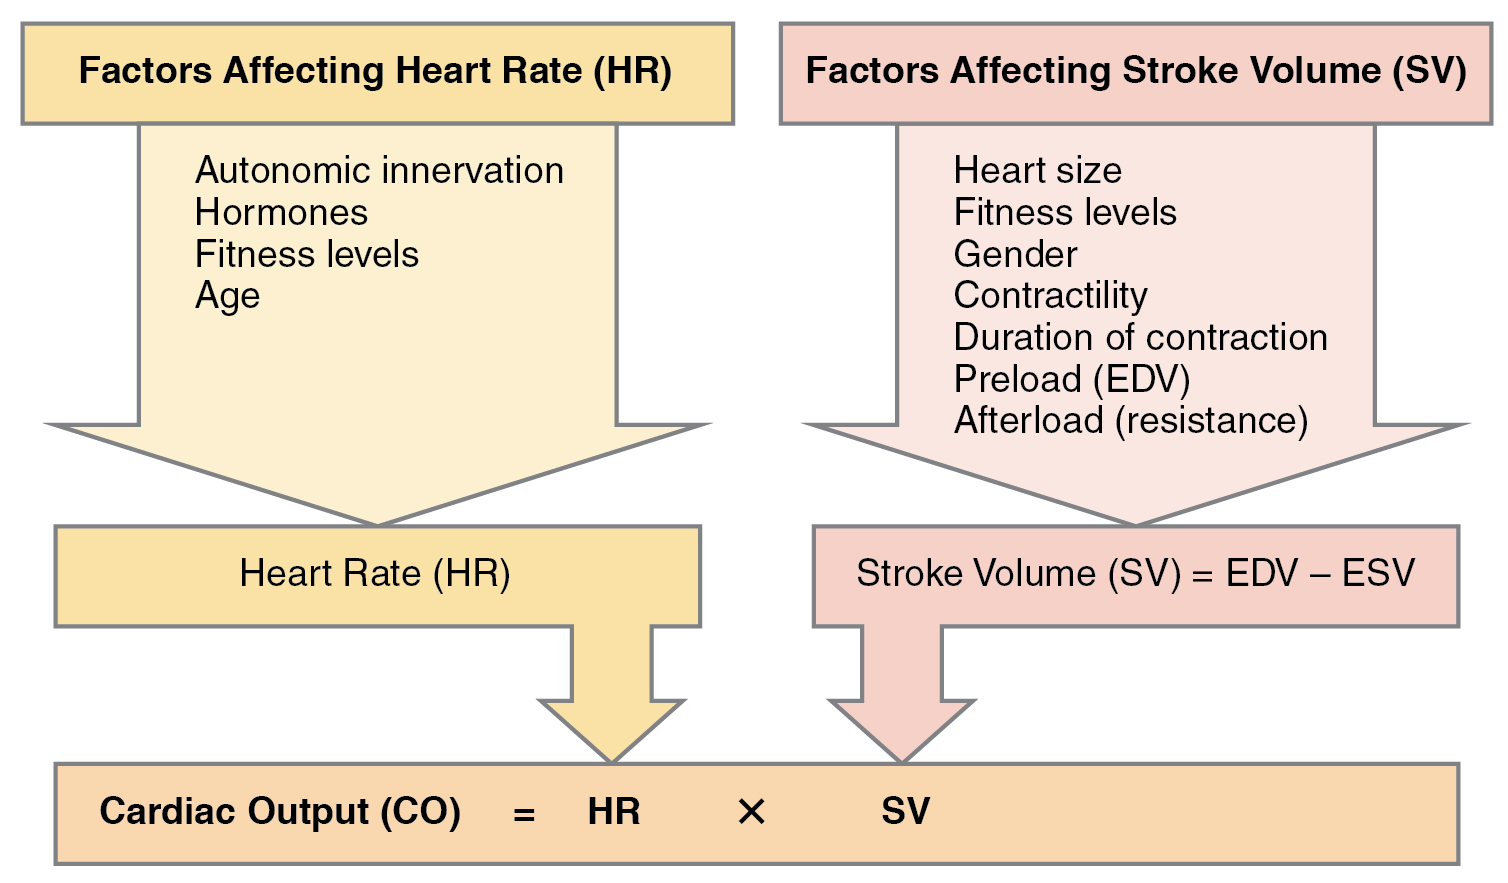
Cardiac Physiology. Cardiac output (CO) is determined by multiplying the Heart Rate (HR) by Stroke Volume (SV). HR is beats per minute and can be determined by counting the number of “lub” and “dub” sounds per minute by auscultation or by taking the pulse from the wrist (brachial artery) or neck (carotid artery). Heart rate can also be determined by using the ECG and counting the number of QRS peaks per minute. SV is the volume of blood pumped by the ventricles. SV is the difference between End Diastolic Volume (EDV) and End Systolic Volume (ESV).
Many factors affect HR and SV and together, they contribute to cardiac function. HR is largely determined and regulated by autonomic stimulation and hormones. There are several feedback loops that contribute to maintaining homeostasis dependent upon activity levels. SV is regulated by autonomic innervation and hormones, but also by venous return. Venous return is the volume of blood that returns to the atria of the heart and is determined by activity of the skeletal muscles, blood volume, and changes in peripheral circulation. Figure 19.14 summarized the main influencers of cardiac output.
Pre-Laboratory Questions
After you review the Background information above, answer the following questions before attempting the Exercises in the laboratory.
- What are the main chambers of the heart? Sketch and label each.
- What are the main blood vessels that bring blood into and pump it out of the heart? Sketch and label each. Indicate which one brings blood “into” and which one takes blood “out of” the heart.
- What is the function of the coronary arteries and veins? Where are these located?
- List the nodes and fibers involved in cardiac conduction starting with the pacemaker and listing these structures in the order of activation.
- List the steps in the cardiac cycle starting with a heart that has all chambers relaxed.
- What do the P, QRS and T designation on an ECG correlate to in atrial and ventricular depolarization/repolarization and contraction/relaxation?
- Which event produces the “lub” and “dub” sounds of the heart beat?
- What is auscultation and the name of the instrument used for it?
- What is the formula for cardiac output?
- List one way in which you can determine heart rate.
Exercises
- Exercise 1 Pig or Sheep Heart Dissection – Heart Anatomy
- Exercise 2 Blood Flow Through the Heart (optional)
- Exercise 3 Electrocardiogram (ECG) Analysis in Normal and Diseased Hearts
Exercise 1 Pig or Sheep Heart Dissection – Heart Anatomy
Dissection guide: https://www.biologycorner.com/anatomy/circulatory/heart/heart_dissection.html
Required Materials
- dissection tray,
- dissection tools (knife or scalpel; forceps; scissors; dissection pins for labeling)
- gloves
- preserved pig or sheep heart
- T-pins
- labeling tape
- Heart Model on a Stand
- Giant Heart Model
- Heart Bismount
Procedure
- Orient yourself to the superficial aspect of the heart first. Many preserved specimens have fat associated with them, making the features difficult to see (unlike models). If the fibrous pericardium is intact, slit it open with a scalpel or cut it with scissors, then cut it from the attachments. Note how the visceral pericardium differs from the parietal pericardium.
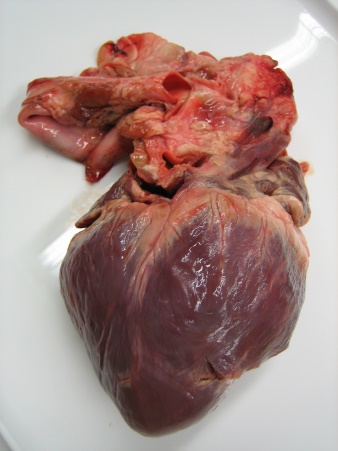
Figure 19.15 Pig’s Heart. Superficial view of the extracted pig’s heart prior to dissection (Credit: Wikimedia Commons, Creative Commons CC-BY-SA license) 2. Examine the external surface of the heart. Determine which side is superior (broad, with large blood vessels issuing from it) and which side is inferior (the apex is pointed). Next, determine which side is anterior. Locate the pulmonary trunk. This large vessel delivers blood to the lungs from the right side of the heart. It can be found in the middle of the anterior side of the heart. Place a pin on the pulmonary trunk and label it using tape. Take a picture and insert it below.
 3. Once you’ve distinguished anterior from posterior aspects of the heart, you should locate the auricles, the puppy-ear-shaped external extensions of the atria. The rest of the heart will be the ventricles. With your gloved hands you may be able to distinguish between the right and left ventricles – the right ventricle is smaller and thinner-walled, and will feel flabby when you squeeze it. You should also be able to feel with fingers the interventricular sulcus (but it may be filled with fat). The atrioventricular sulci can also be felt just underneath the auricles on each side. Use the pins to label the atria and ventricles. Take a picture and insert it below.
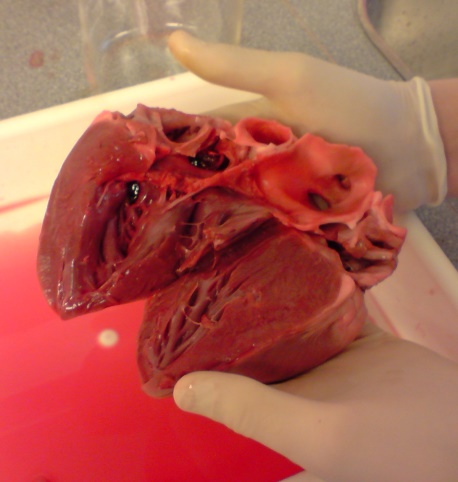
4. Using a scalpel, make a single cut through the ventricle up to the atria / base of the heart, so that the heart is divided into anterior and posterior halves. Open the two halves (or, if you’ve cut completely through the heart, separate the two halves) so that you can observe the internal features of the heart. Identify the AV valves (bicuspid and tricuspid) and their features, including the chordae tendineae and their attachment to the papillary muscles. Within the walls of the ventricles, you should be able to see and feel the trabeculae carneae, or muscular ridges that are distinct from the papillary muscle. The thick interventricular septum between the right and left ventricles should be very evident. Note that the walls of the left ventricle are much thicker than those of the right ventricle. In the atria, you may be able to see and feel the ridges of the pectinate muscles. Use pins to label these structures. Take a picture and insert it below.
5. Using the pictures you took as guide, create a drawing to show the anatomical features of the heart in the space provided below On your drawing, label the right and left ventricles, the right and left atria, the bicuspid and tricuspid valves, the papillary muscles, the chordae tendineae, the interventricular septum, the pulmonary trunk and the aorta.
Exercise 2 Blood Flow Through the Heart (optional)
Required Materials
- dissected pig or sheep heart
- gloves
- T-pins
- labeling tape
Procedure
Use the dissected heart to label the path of the heart from the entry of blood into the heart chambers to the exit of blood from these chambers and out of the heart. Use the dissecting pins and tape to label the following.
1.Find and label the veins that bring blood to the heart. Take a picture and paste it below.
2. Label the heart chambers into which blood flows. Take a picture and paste it below.
3. Label the two heart valves through which blood flows from the entry chambers to the exit chambers. Take a picture and insert it below.
4. Label the two chambers from which blood gets pumped out. Take a picture and insert it below.
5. Identify the arteries that carry blood out of the heart from the two chambers you labeled above. Label each artery. Take a picture and insert it below.
6. Using the pictures you took as a guide, create a drawing to trace the path of blood flow from entry into to exit from the heart. Label the veins, the heart chambers, the heart valves, and the arteries. Use red color to show oxygenated blood and blue color to show deoxygenated blood.
Exercise 3 Electrocardiogram (ECG) Analysis in Normal and Diseased Hearts
Required Materials
- stethoscope
- timer
Procedure
1.Use the stethoscope as shown in Figure 19.17 to listen to the heart sounds of a classmate. Count the number of beats per 10 seconds. Record this value here: __________
2. Calculate how many seconds it takes from the start of one heart beat to the next. Record: __________
3.Calculate how many beats the heart beats per minute (60 seconds) in BPM (beats per minute). Record: ______
4. Examine the following EKG (also known as ECG):
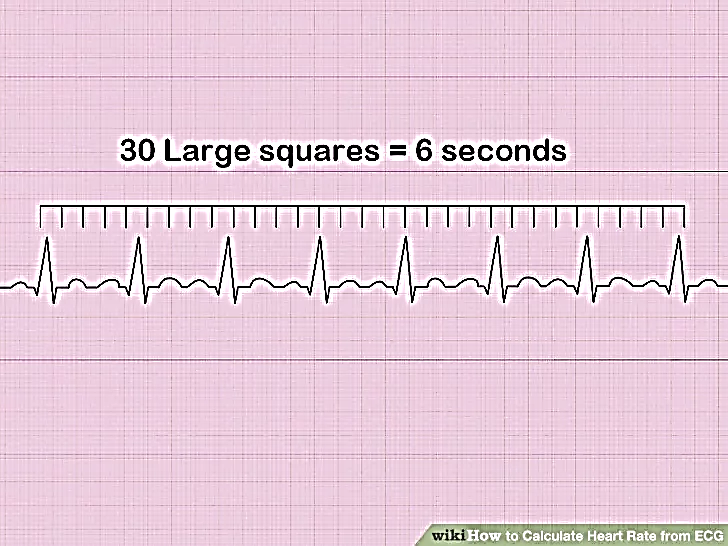
5. How many QRS complexes do you count within the 6 seconds indicated by the 30 large squares of the EKG paper in Figure 19.18? Record:__________
6. What is the heart rate corresponding to this EKG trace? Calculate it in BPM. Record: __________
7. If this EKG were taken from the friend whose heart rate you determined above, how many QRS complexes would you expect to see within the 6 second window of the EKG? Record:_________
8. How many squares from the left edge would you expect to hear the first “lub” sound? Last “lub” sound (in Figure 19.18)? Record:__________
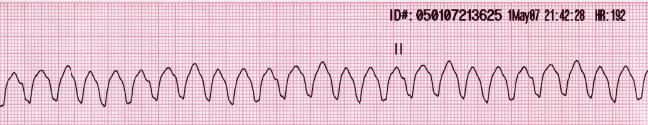
9. In Figure 19.19, you have the ECG recording of a patient with a condition called tachycardia. Count the number of peaks per 30 squares to determine the 6 second and then the 1 minute heart rate in BPM. Record: ______, ________
10. How does the heart rate in tachycardia compare to the heart rate in the normal ECG shown in Figure 19.18?
11. If you were to guess, what do you think the word Tachycardia refers to based on your findings above?
Post-laboratory Questions
- Scenario 1: You dissect a pig’s heart and see that there is a hole between the right atrium and left atrium.
- What would be the effect of this hole on the oxygenation level of the blood pumped out of the heart into the systemic circulation?
- Explain the reasoning behind your answer. Use a sketch of the heart to help.
- Scenario 2: You dissect a pig’s heart and see that the tricuspic atrioventricular valve is instead bicuspid. You read some medical literature on this subject and learn that this condition may result in the valve not closing properly.
- What effect will this have on the ability of the heart to pump blood out of the heart?
- Will this affect pulmonary circulation or systemic circulation?
- Explain the reasoning behind your answers to (a) and (b). Use a sketch of the heart to help.
- In lab, you use a stethoscope to auscultate with a stethoscope and listen to the apical pulse of a classmate.
- If you hear 20 “lub” and “dub” sounds in 15 seconds, what is the heart rate of your friend in BPM?
- In the cardiac cycle, what does the “lub” sound you hear correspond to? How about the “dub” sound?
- If you obtain an EKG of the same classmate, how many QRS complexes do you expect to see in the 30 large squares of the EKG paper that correspond to 6 seconds?
