
24 Chapter 24 Metabolism and Nutrition
By Joseph D’Silva
Motivation.
Metabolism concerns a number of reactions in the cell to provide energy for the body to function. The energy comes from food. Diabetes and obesity are two disorders of the digestive system that are closely linked to metabolic reactions. In diabetes, the level of sugar in the blood cannot be maintained at a homeostatic level. Obesity is defined as an excessive accumulation of fat. The occurrence of both diabetes and obesity in the United States and among African Americans is higher compared to other racial groups.
Diabetes is prevalent particularly among ethnic minority populations. Native Americans, Mexican Americans, and African Americans show a higher rate of diabetes than other populations according to several studies. It is well established that several ethnic minority populations, such as Native Americans, Mexican Americans, and African Americans, are particularly prone to obesity. More interestingly, Afro-American women have a higher rate (37.4%) than their counterpart white women (22.4%). That is, a Body Mass Index in (kg/m2) >30. There are a number of reasons for being obese: genetics, culture, lack of physical exercise….to name a few. But diabetes is a disorder that can be managed by putting strict disciplines into our daily lives. Healthy eating habits, regular exercise and motivation can reduce the risks of diabetes.
Learning Objectives
Upon completion of the work in this chapter students should be able to:
- Define carbohydrate metabolism and observe in yeast
- Define diabetes and causes and measure blood sugar levels
- Define obesity and BMI and measure BMI.
- Make a meal plan using MyPlate nutritional recommendations
Background.
In physiological terms, metabolism is the sum total of all the chemical reactions that occur in the human body to produce energy and eliminate waste. Nutrition is linked to metabolism. We derive energy that we generate in our body is provided by carbohydrates, proteins and fats. Carbohydrates are made up of glucose molecules. For example, a molecule of glucose is C6H12O6.. When carbohydrates are eaten and absorbed in the small intestine by cells, the glucose molecule is converted to ATP which is energy. The reaction that occurs is:
C6H12O6 + 6O2 —> 6CO2 + 6 H2O +36 ATP (energy)
A complex set of reactions take place by which a molecule of glucose combines with six molecules of oxygen to produce six molecules of carbon dioxide and six molecules of water. In metabolism, two concepts need to be studied: catabolism and anabolism. In catabolism, complex molecules are broken down to simpler ones. Anabolism is where simple molecules are combined to form complex ones. Breaking down a molecule of glucose (C6H12O6 ) is a catabolic reaction.
Glucose concentration in our body can be measured and the normal level is 4.4 to 6.1 mmol/L (79 to 110 mg/dL). The blood sugar level can by measured using simple at-home test kits. In diabetics, the amount is above this level and can reach up to 200 mg/dL.
Table 1. The levels of blood sugar before and after a meal.
| Fasting | <100 mg/dL |
| Before meal | 70-130 mg/dL |
| After meal | <189 mg/dL |
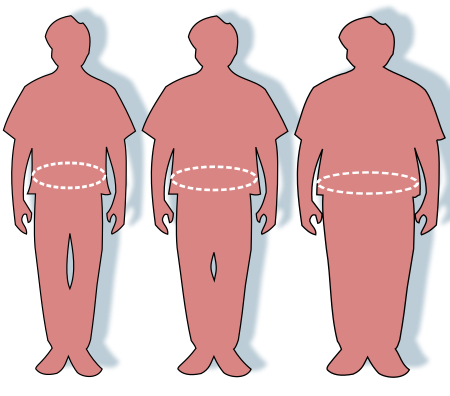
Excessive intake of carbohydrates in diabetics can lead to increase in blood sugar level. Obesity takes place when excessive amounts of calories produced by the body through food intake are not burned or spent The weight of a person can define his/her obesity and can be measured by the BMI (Body Mass Index) where the mass is the weight divided by the height2 (kg/m 2). The table below compares the ranges of weight to indicate obesity.
Table 2 BMI vs. weight category
| Category[25] | BMI (kg/m2) |
|---|---|
| Underweight | < 18.5 |
| Normal weight | 18.5 – 24.9 |
| Overweight | 25.0 – 29.9 |
| Obese (Class I) | 30.0 – 34.9 |
| Obese (Class II) | 35.0 – 39.9 |
| Obese (Class III) | ≥ 40.0 |
Behavioral, genetic and metabolic causes also play a role in obesity. Diabetes and obesity are linked to nutrition. Uncontrolled dietary habits or intake of too many calories of food can cause blood sugar levels to increase and/or lead to obesity. Practical steps can be taken to reduce carbohydrate and obesity. People who are diabetic or obese face high risk factors. (Include) Fortunately, both of them are manageable with rigorous exercise and diet control.
Pre-Laboratory Questions
1. Define metabolism.
2. Explain the role of glucose in metabolism
3. Define diabetes and the role of sugar consumption in diabetes.
4. Define obesity and BMI.
5. Describe how food consumption (nutrition) is related to metabolism.
Exercises
- Exercise 1 Determine blood sugar levels
- Exercise 2 Effect of sugar intake on blood sugar levels
- Exercise 3 Determination of BMI
- Exercise 4 Effect of sucrose levels on yeast metabolism
- Exercise 5 Application of USDA dietary guidelines (optional)
Exercise 1 Determine blood glucose levels
Required Materials
- Lancets
- Glucose test strips
- Glucose meter (instruction manual)
- Alcohol wipes
- Biohazardous waste container
- Bloodborne Pathogens Safety Training
Procedure
- Take an unused glucose test strip and place it in the glucose meter (orient as indicated in instruction manual)
- Use an alcohol wipe to thoroughly clean a fingertip (your own only!) and let try thoroughly (alternatively, use prepared sheep’s blood).
- Take a new lancet, gently and quickly press on fingertip and release.
- Place the used lancet in the provided biohazardous waste container.
- Touch the tip of the glucose strip in the glucose meter to the drop of blood on your fingertip.
- Read the value shown on the meter screen. Record here:________
- Remove the glucose strip from meter and discard in biohazardous waste container.
- Use an alcohol wipe to clean the fingertip.
Exercise 2 Effect of sugar intake on blood sugar levels
Required Materials
- 8 oz. bottles of water (unopened)*
- Teaspoon measures*
- Sugar*
- Lancets
- Glucose test strips
- Glucose meter (instruction manual)
- Alcohol wipes
- Biohazardous waste container
*These are kept and used in designated area outside the lab that is safe for food and drink consumption only. (Alternatively, use prepared sheep’s blood)
Procedure
1.Prepare the following 5 bottles of water:
-
- Water: nothing added to bottle
- 1% sugar solution: 1/2 teaspoonful of sugar added to bottle
- 2% sugar solution: 1 teaspoonful of sugar added to bottle
- 3% sugar solution: 1 1/2 teaspoonful of sugar added to bottle
- 5% sugar solution: 2 1/2 teaspoonful of sugar added to bottle.
2. One person from the group: Drink the water. Measure your blood glucose level as done in Exercise 1 (alternatively use prepared sheep’s blood ). Enter the data in Table 3 below.
3. Drink the 1% sugar solution (alternatively use prepared sheep’s blood plus sugar solution). Wait for 10 minutes. Measure your blood glucose level as done in Exercise 1. Enter the data in Table 3 below.
4. Drink the 2% sugar solution (alternatively use prepared sheep’s blood plus sugar solution). Wait for 10 minutes. Measure your blood glucose level as done in Exercise 1. Enter the data in Table 3 below.
5. Drink the 3% sugar solution (alternatively use prepared sheep’s blood plus sugar solution). Wait for 10 minutes. Measure your blood glucose level as done in Exercise 1. Enter the data in Table 3 below.
6. Drink the 5% sugar solution (alternatively use prepared sheep’s blood plus sugar solution). Wait for 10 minutes. Measure your blood glucose level as done in Exercise 1. Enter the data in Table 3 below.
Table 3 Blood glucose levels
| Concentration of Sugar (%) | Amount of Sugar in Blood(mg/dL) |
| 1% | |
| 2% | |
| 3% | |
| 5% | |
| Water |
Analysis Questions:
- Does the blood sugar level rise with concentration of sugar?
- Why did you use water only to test blood sugar level for this experiment?
- What other factor might make your blood sugar level vary?
- In real life, what might this tell you about the consumption of carbohydrates in large quantities?
Exercise 3 Determination of BMI
Required Materials
- Tape measure or meter ruler
- Scale
Procedure
- Use a tape measure or meter ruler to determine your height (one person from your group) and four of your peers (one person from each other group).
- Measure your weights using the scale. Insert the data in the table below. Then, use the formula BMI = Weight/height2 (kg/m2) to calculate BMI (Body Mass Index). Enter weight, height, and BMI into Table 4 below.
- What does the data indicate about your category of obesity? Refer to Table 2 above. Enter Category into Table 4 below.
Table 4 Class data for BMI.
| Height (m) | Weight (kg) | BMI (kg/m2) | Category |
| 1. | |||
| 2. | |||
| 3. | |||
| 4. | |||
| 5. |
Exercise 4 Effect of sucrose levels on yeast metabolism
Required Materials
- 5 yeast cells plates on solid agar medium containing 1% (wt/vol) yeast powder* (grown for 2-3 days, differing sucrose concentrations as shown in Table 5)
- Ruler
Procedure
- The goal in this exercise is to observe the role of sugar on colonies of yeast cells. The yeast cells were cultured in a growth medium that has been supplemented with varying concentrations of sucrose (a carbohydrate) which is found in everyday food. See Table 5 below.
Table 5 Role of carbohydrates in nutrition
| Growth medium | Concentration of added sucrose |
| (A). Cells were plated on solid medium containing 1% (wt/vol) yeast powder * | 0.0% (wt/vol). |
| (B) Cells were plated on solid medium containing 1% (wt/vol) yeast powder * | 0.25% (wt/vol). |
| (C) Cells were plated on solid medium containing 1% (wt/vol) yeast powder * | 0.5% (wt/vol) |
| (D) Cells were plated on solid medium containing 1% (wt/vol) yeast powder * | 1% (wt/vol) |
| (E) Cells were plated on solid medium containing 1% (wt/vol) yeast powder * | 2% (wt/vol). |
*Adapted with permission from Manuel Alonso, Carlos A. Stella. 2012. Teaching nutritional biochemistry: an experimental approach using yeast. Adv. Physiol. Edn., 36: 313-318.
2. Your instructor will supply you with Petri dishes containing a growth medium that has been inoculated with yeast cell for two to three days.
3. When yeast cells grow, they form colonies. The size of the colonies will indicate the effect of different concentrations of sucrose which is a carbohydrate.
4. Use a ruler to measure the diameter of the colony. Small colony growth will be limited while medium growth will be larger in diameter. Full growth will be largest in diameter. Record your data in the table below. Photograph the colonies. Use Table 6 below to insert your photos as well.
Table 6. Results of yeast growth on agar plates
| Sucrose Concentration (wt/vol) | Growth (small or medium or full) | Photograph |
| A. 0.0% | ||
| B. 0.25% | ||
| C. 0.5% | ||
| D. 1% | ||
| E. 2% |
Analysis Questions
- Which concentration of sucrose yielded the most number of colonies? What does this tell us about the role of sucrose (a carbohydrate) in our diet?
Exercise 5 Application of USDA dietary guidelines (optional)
Required Materials
- Choose My Plate Poster
- Nutrition and Metabolism Poster
- USDA MyPlate Web Site: https://www.myplate.gov/
Procedure
- Open https://www.myplate.gov/
- Explore the MyPlate Food Groups: Fruits, vegetables, grains, protein foods, and dairy.
- The Dietary Guidelines for Americans, 2020-2025 are available. Learn more
- Now study Table 1-1 Healthy U.S. Style Dietary Pattern at the 2,000-Calorie Level, With Daily or Weekly Amounts From Food Groups, Subgroups, and Components.
- Table 1-1 shows what you need to consume to maintain a 2,000 calorie level of food intake. Write down the recommendations here:
Post-laboratory Questions
1. Metabolism can be defined as reactions that take place in our body. Carbohydrate metabolism refers to the breakdown of _______(glucose) to produce _______ .
2. The level of glucose at any time in our body can be determined by a glucose test. Fasting blood sugar refers to blood sugar level sampled after ____ since the last meal was eaten.
3. Based on the BMI recorded in your class, _____ persons were not obese. The criterion for obesity is a BMI between ______ and ______ kg/m2.
4. How much of each category of the food groups of the fruit, protein, vegetables, dairy, and grain is needed to maintain a 2000 calorie level of nutrition for a female person who is 19 years old, is 5’5″ tall and weights 150 lbs? Go here to find out.
- fruits: _____cups
- protein: _____ounces
- vegetables: _____cups
- dairy: _____cups
- grain: ______ounces
5. Are you making every bite count? Take the MyPlate Quiz to find out! Levels have been added to the MyPlate Quiz. Take the quiz today to find out your level and get personalized resources to Start Simple with MyPlate.
- Start Quiz
- Insert a screenshot of your quiz results below.